


UK Cities House Price Index – December 2017
The December 2017 figures for UK cities’ house sales are summarised:
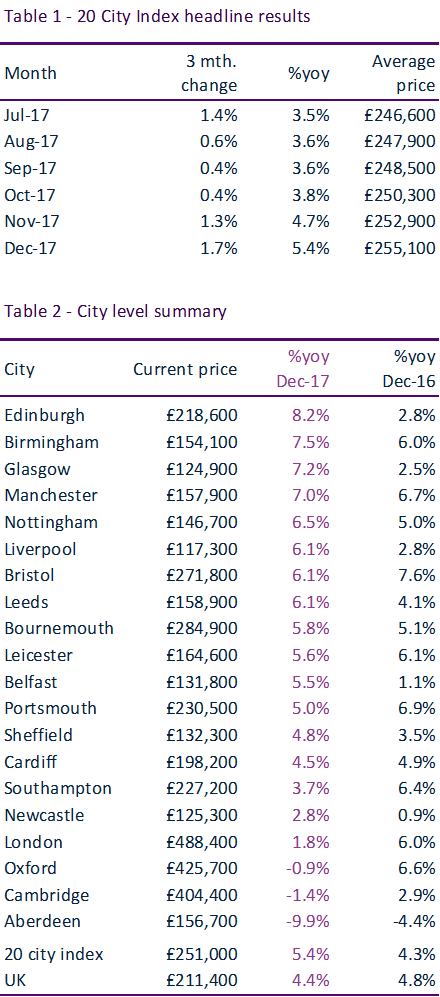
- UK city house price inflation slows to 5.4%.
- Weak price growth in London (+1.8%) offsets continued robust growth in large regional cities. Edinburgh, Birmingham, Glasgow and Manchester all registering growth of over 7% per annum.
- The discount from asking to sales prices is an important measure of underlying demand. The level of discounting is increasing in London while across other cities the discount is narrowing.
There has been continued growth in large regional cities, despite house price inflation slowing to 5.4%. ZPG listings data shows discounts to asking prices are narrowing, indicating market conditions are improving across cities outside south eastern England. Increased discounting can be seen in London, where price growth has slowed to +1.8%.
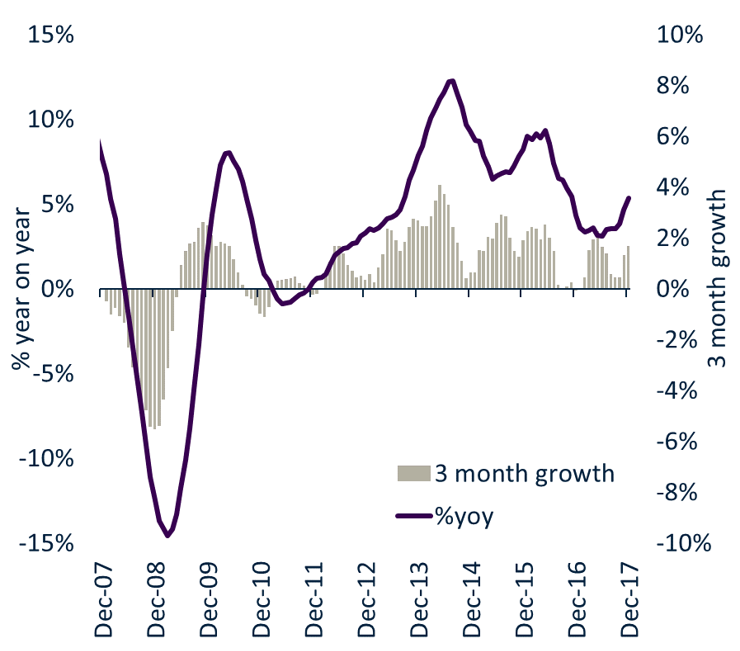
City house price growth slows to 5.4%UK city house price inflation has slowed to 5.4% as weak house price growth in London offsets above average growth rates in large regional cities.
Four cities registering growth of over 7%
Edinburgh remains the fastest growing city (+8.2%) followed by Birmingham, Glasgow and Manchester where average prices are rising at over 7% per annum.
Prices falling in three cities
House prices are falling in nominal terms across three cities – Oxford, Cambridge and Aberdeen – a result of weakening demand, affordability and economic factors.
Discounts to asking prices are narrowing
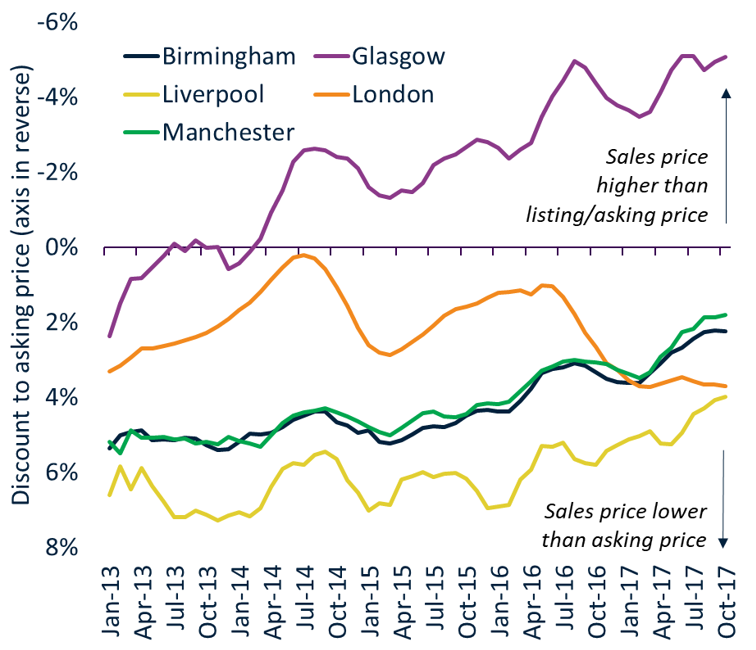
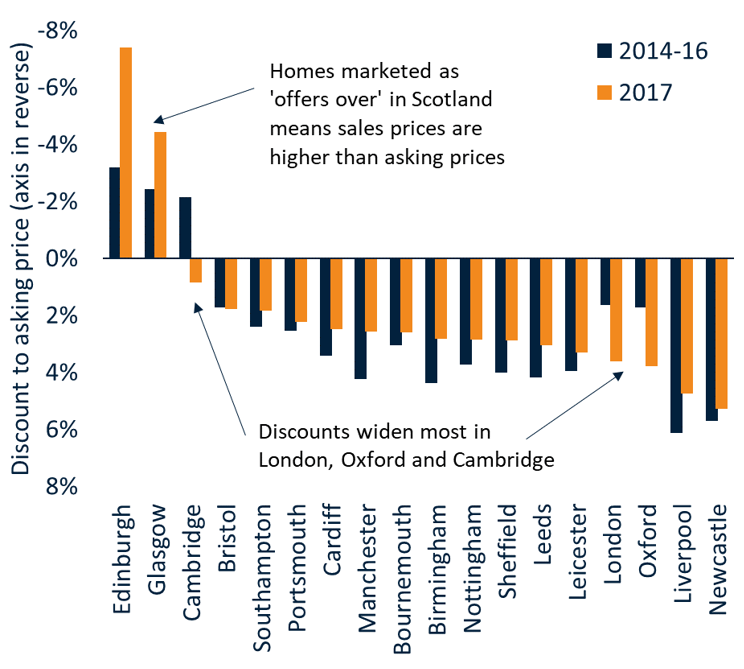
Analysis of ZPG listings data reveal how underlying market conditions continue to improve across cities outside south eastern England. The discounts sellers are accepting to achieve a sale are shrinking. The average discount over 2014-2016 was 3.2% which has reduced to 2.9% in 2017 across England. A different system for selling homes in Scotland means sales prices are higher than listings prices (see Fig.2 and Fig.3).
Manchester and Birmingham see discount halve
Birmingham and Manchester have recorded the greatest decrease in discounts over the last year. Figure 2 shows how the discount has more than halved from 6% in 2013 to just 2.7% in 2017. This is more evidence of the underlying strength of the market in these cities. Not only are headline prices growing at 6%-8% per annum but discounts to listing price are narrowing.
A similar pattern has been recorded for cities outside southern England (Fig.3). This supports our view that there is further above average house price growth to come over 2018.
Sales prices at a premium in Edinburgh and Glasgow
The Scottish system for selling homes is different to England and Wales with property typically marketed as ‘offers over’ a listing price. Our analysis shows that sales values are at a premium to listings prices. The premium has increased over 2017 to average 4% in Glasgow and 7% in Edinburgh (Fig.3). This is consistent with robust levels of price inflation currently being recorded in these cities and reports of a shortage of homes for sale.
Increased discounting in London as demand weakens
London has registered increased levels of discounting. In 2014, when the rate of house price growth was almost 20% per annum, the average discount to asking price was just 0.5%. Weaker, price sensitive demand has seen the discount widen to an average of 4% with the largest discounts of up to 10% being registered in inner London where price falls are most concentrated.
Larger discounts point to headline price falls
The level of discounting provides insight into the strength of underlying demand. Asking prices tend to act as the ‘shock absorber’ to softer pricing as demand weakens. However, once discounts get close to 10%, this is when falls in headline prices start to occur.
Kindly shared by Hometrack


