


How have house prices changed in your area since the Brexit referendum?
UK house prices increased by an average of 11% in the 40 months following the EU referendum, with more than half of local authorities seeing rises of at least 10%.
The last few years have been a tumultuous time for UK economy, but exclusive Which? research reveals that the housing market has remained largely robust.
Here, we look beyond the scare stories and explain what’s really happened to house prices in your area since the vote.
UK house prices rise by 11% since referendum
We’ve analysed data from the Land Registry to assess how house prices changed in the 40 months following the EU referendum.
And it’s largely been a positive tale.
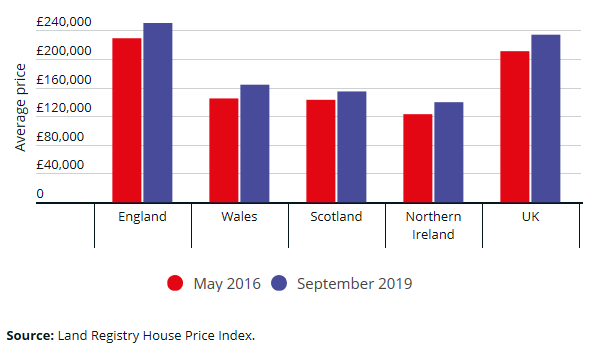
Overall, the average UK house price increased by 11% to reach £234,370, though the level of growth varied between countries.
Northern Ireland and Wales (13%) saw the biggest rises, followed by England (9%) and Scotland (8%).
Which regions saw the biggest rises?
After years of increases, the most expensive regions of England saw price growth slow down after the referendum.
Political uncertainty around Brexit resulted in London buyers, in particular, becoming more reluctant – or simply unable – to pay the capital’s high prices and moving further out into the south east.
The biggest regional rises came in the West Midlands (15%) and East Midlands (13%).
| Region | House price change |
| West Midlands | 15% |
| East Midlands | 13% |
| North West | 13% |
| Yorkshire & The Humber | 11% |
| South West | 11% |
| East of England | 8% |
| North East | 7% |
| South East | 7% |
| London | 0.5% |
Best and worst local authorities
Regional data gives us a taste for what’s happening in the market, but the truth is that house prices fluctuate from town-to-town, and sometimes even from street-to-street.
With that in mind, we assessed 391 local authorities across the UK, and found that more than half (207) saw house prices grow between 10% and 20%, while a third (138) saw rises of up to 10%.
Where did house prices rise by more than 20%?
Some areas saw prices rocket following the referendum, with 21 local authorities enjoying rises of more than 20%.
The Welsh city of Newport (26%) and Scotland’s Orkney Islands (25%) led the way, followed by Corby, Monmouthshire and Hinckley.
The table below shows the local authorities which experienced the highest house price increases after the referendum. Use the search bar to see if your town made the cut.
| Local authority | Region | House price change | Average house price |
| Newport | Wales | 26.2% | £188,792 |
| Orkney Islands | Scotland | 25.4% | £153,698 |
| Corby | North East | 24.7% | £191,479 |
| Monmouthshire | Wales | 24.7% | £275,931 |
| Hinckley and Bosworth | East Midlands | 24.4% | £228,214 |
| Salford | North West | 23.5% | £170,904 |
| Allerdale | North East | 22.7% | £163,466 |
| Tameside | North West | 22.4% | £156,248 |
| Neath Port Talbot | Wales | 22.0% | £124,480 |
| Thanet | South East | 21.6% | £246,866 |
| Manchester | North West | 21.3% | £181,632 |
| Harborough | East Midlands | 21.1% | £299,089 |
| Pembrokeshire | Wales | 21.1% | £182,097 |
| Forest of Dean | South West | 21.1% | £246,396 |
| Blaby | East Midlands | 20.9% | £236,330 |
| Oadby and Wigston | East Midlands | 20.7% | £229,808 |
| Suffolk Coastal | East | 20.3% | £305,580 |
| Fermanagh and Omagh | Northern Ireland | 20.3% | £132,642 |
| Sandwell | West Midlands | 20.3% | £152,053 |
| Bromsgrove | West Midlands | 20.2% | £298,694 |
| Wolverhampton | West Midlands | 20.2% | £156,940 |
Source: Land Registry. Average house price based on September 2019.
Where did house prices fall?
At the other end of the table, 25 local authorities saw house prices fall after the vote, though seven only experienced small drops of less than 1%.
19 of these areas were in London or the South East of England, reiterating the struggles facing sellers in more expensive markets.
The Scottish city of Aberdeen (17%) and London’s Westminster (13%) were the only two areas to see double-digit drops.
| Local authority | Region | House price change | Average house price |
| Aberdeen City | Scotland | -16.9% | £148,021 |
| Westminster | Greater London | -12.8% | £897,094 |
| Three Rivers | East | -4.6% | £493,524 |
| Tower Hamlets | Greater London | -4.2% | £438,037 |
| Bracknell Forest | South East | -4.1% | £331,503 |
| Hammersmith and Fulham | Greater London | -4.0% | £716,530 |
| Aberdeenshire | Scotland | -3.4% | £184,515 |
| Shetland Islands | Scotland | -3.2% | £169,070 |
| Mole Valley | South East | -2.3% | £474,984 |
| Ealing | Greater London | -2.1% | £479,648 |
| Camden | Greater London | -2.0% | £739,557 |
| Brentwood | East | -2.0% | £431,976 |
| Reading | South East | -1.9% | £296,625 |
| Haringey | Greater London | -1.7% | £546,294 |
| Southwark | Greater London | -1.7% | £508,698 |
| Epsom and Ewell | South East | -1.5% | £452,907 |
| St Albans | South East | -1.4% | £515,342 |
| Richmond upon Thames | Greater London | -1.3% | £650,810 |
| Wandsworth | Greater London | -0.8% | £602,178 |
| Cherwell | South East | -0.6% | £288,178 |
| Watford | Greater London | -0.6% | £344,471 |
| Elmbridge | South East | -0.4% | £601,918 |
| West Oxfordshire | South East | -0.4% | £319,050 |
| Redcar and Cleveland | North East | -0.3% | £188,536 |
| Barnet | Greater London | -0.3% | £523,068 |
Source: Land Registry. Average house price based on September 2019.
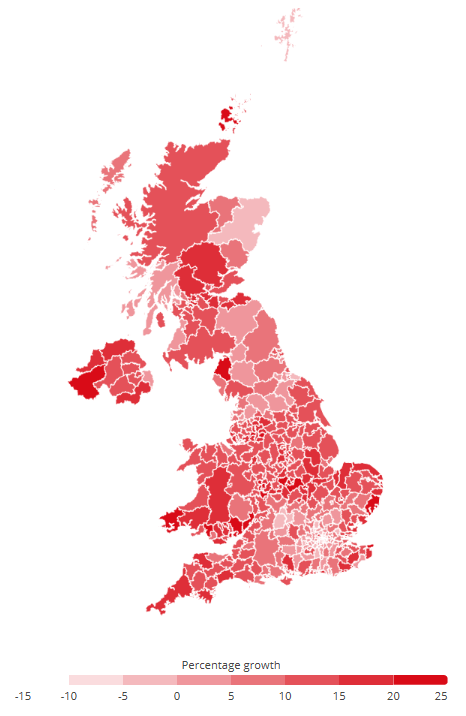
Mapped: how have prices changed in your town?
Our interactive map shows what happened to house prices in 391 UK local authorities in the 40 months following the EU referendum.
You can find out whether house prices rose or fell in your local authority by hovering your cursor over the map. Use the buttons in the top left corner to zoom in and out.
Has the property market picked up since Brexit?
The property market remained remarkably robust amid uncertain economic times, but there’s no doubt that both buyers and sellers have experienced jitters over the last couple of years.
Now though, there appears to be a renewed sense of optimism on both sides.
Data from Rightmove shows that asking prices increased by 2.3% in the month following December’s general election – the biggest rises seen in any January since the portal started keeping records in 2002.
The portal also says January was its busiest month on record, with 152 million visitors to the website and the percentage of sales agreed by agents up by 12% year-on-year.
We won’t know to what degree this uplift has translated into actual sales for a couple of months, however, as the Land Registry’s House Price Index runs with a two month delay.
Will house prices rise in 2020?
While confidence appears to be returning, there’s no guarantee that we’ll see the Brexit-boost continue throughout the year.
There are plenty of hurdles still in the way – an uncertain Brexit transition period, the upcoming Spring Budget and possible changes in the Bank of England base rate could all see the market shift and sway.
This explains why property commentators have been reserved in their predictions for 2020.
Rightmove, Zoopla and the Royal Institute of Chartered Surveyors (RICS) have all predicted a 2% rise in house prices this year, while Halifax predicts growth of between 1% and 3%.
How much is your house worth?
If you’re thinking of selling your home this year, it’s important to find out its true value – and this can be difficult in the current market.
As a starting point, follow these four tips to get a reliable indication of how much your house is worth.
- Get three valuations from local agents
The old-fashioned method of asking three estate agents to estimate the value of your home still has a place in 2020.
Ideally, choose based on recommendations from family and friends, and ensure you pick at least one longstanding local agency.
Beware of unrealistic estimates from agents battling to secure the instruction.
- Use the Land Registry
The Land Registry’s ‘price paid’ tool allows you to search for properties by street or postcode, so you’ll be able to easily check out how much your neighbour’s home has sold for.
Similarly, Zoopla’s ‘house prices’ tool shows sold prices on your street and offers a prediction of current property values.
- Search the market
Use your portal of choice to search for homes currently on the market on your street.
Rightmove’s ‘market info’ tab allows you to view properties that have sold or are under offer, and every Zoopla listing shows when a property was brought to the market, whether it’s been reduced in price and how much by.
- Test the water
If you’re considering selling your home but aren’t yet ready to take the leap, you can test the water by using Zoopla’s ‘TemptMe’ tool.
This allows you to create a page for your property on the portal and set a price that you’d consider too good to refuse, while stopping short of putting your home on the market.
Kindly shared by Which?


