


HomeTrack publish their UK House Price Index for July 2021
HomeTrack have published their UK House Price Index for July 2021, which shows the position with housing stock, the number of sales, and supply constraints.
Key points from report:
- Total stock of homes for sale is 26% down from 2020, and will remain low well into 2022
- Higher number of sales in last year has eroded supply, especially higher levels of activity among first-time buyers and investors
- Supply constraints most evident for houses, and properties priced up to £350,000
Zoopla UK House Price Index and 20-city summary – July 2021
Zoopla House Price Index
Annual UK house price inflation rises
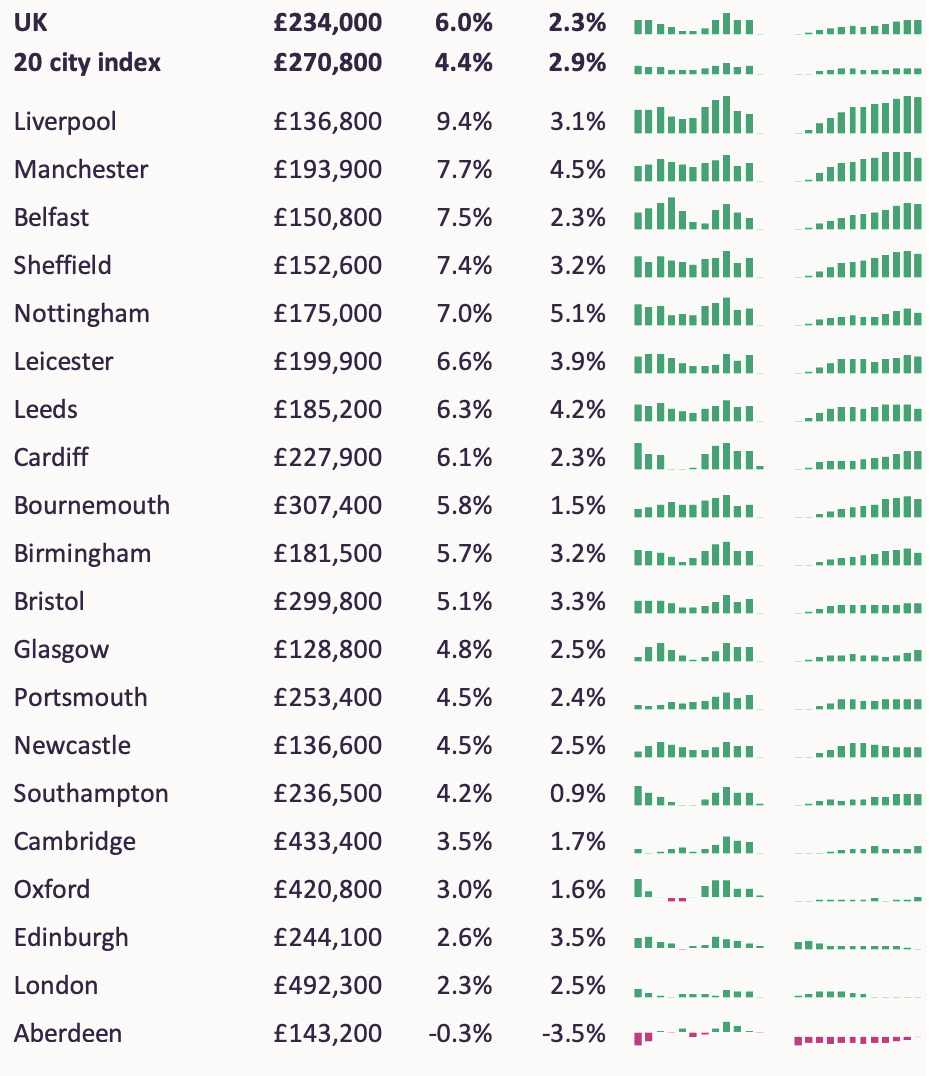
Average house price rose by +1.4% in the three months to the end of July, taking the annual rate of price growth to +6.0%, up from 2.3% in July 2020.
However, this marks a slight slowing of growth from June, when the annual rate of growth was 6.3%. The average value of a home across the UK is now £234,000.
Price growth is highest in Wales (+9.4%), Northern Ireland (+9.0%) and the North West of England (+7.9%). Liverpool continues to lead the way for price growth among the UK’s largest cities, with average home values rising by 9.4%, resulting in an average price uplift of £11,731 to take the average house price to £136,721.
There has also been strong price growth in Manchester and Belfast, at 7.7% and 7.5% respectively. London is still trailing in terms of growth, with an annual 2.5% rise, although this marks a rise from 1.9% growth in March this year.
The rise in home values is being underpinned by the lack of supply in the market, examined in more detail below. We expect that the headline rate of growth will start to moderate as we move into Q4, although this will not be a linear progression.
The slowdown will come as the impetus provided by the elongated stamp duty holiday ends, and the government begins to withdraw the pandemic stimulus packages, such as furlough.
We expect house prices to show an average rise of between 4% and 5% for the whole of 2021.
Lower levels of supply
The flow of new homes being listed for sale, or ‘new supply’, has been around 5% down on typical levels since the start of the year, and is not enough to replenish the total stock of homes for sale, which is down 26% compared to last year.
Looking further back as a comparison, total stock is down 33% compared to this time of year in 2018 and 2019, and 25% lower than 2016 and 2017.
There are several factors which have come together to result in the erosion of the stock of homes available for sale.
First is the sheer level of activity in the market. Completed sales jumped by 25% in the 12 months to June, compared to the same period in 2019, according to HMRC data. This means 1 in 20 homes changed hands over the last year, compared to 1 in 25 two years previously.
Sales agreed also ticked up again in August, and while they are down compared to the peaks seen in early April, they are still running 21% above the levels seen in the summer of 2018/19.
The ‘reassessment of home’ among households as a result of the pandemic, coupled with the tax savings on offer due to the stamp duty holiday, resulted in higher numbers of homeowners making a move. This created churn in the market, but typically a home-mover both buys and sells, creating demand and supply.
Yet with the focus on demand for larger family houses, amid a ‘search for space’, this type of stock has become stretched, reflected in the average price for a house rising 7.6% over the last 12 months. The supply squeeze for flats is more muted, and price growth for this type of home is up 1.2% on the year.
The second key factor is increased levels of activity among first time buyers and investors.
These buyers represent net new demand, as the vast majority have no property to sell. First-time buyers (FTBs) account for around a third of all buyers, and they have been increasingly active in 2021.
Lenders tightened credit criteria and increased mortgage rates on higher LTV loans in 2020 and this squeezed some FTBs out of the market – this has been reversed, and supported more FTBs into the market.
Continued stamp duty relief for FTBs means the end of the stamp duty holiday will have less of an impact on this buyer group.
Yet the activity seen so far this year is likely to be a continued release of the pent-up demand after the first lockdown last year, and so levels of activity will begin to return to more normal levels as we move through the rest of 2021.
Investors were able to take advantage of the lower purchase tax charges as a result of the stamp duty holiday. Demand from buy-to-let investors in the year to date has been some 21% higher compared to 2020, Zoopla data shows.
Strong demand for rental properties is likely to be a continued draw for investors, even as tax changes have caused some landlords to review their portfolios. However, the ending of the stamp duty holiday will likely impact investor demand.
A final factor is the supply of new homes, which has slowed in 2021 due to the shut-down of the construction industry last year during the first lockdown.
New homes completions fell by 11% in England in the year to March. While supply has already started to pick up again, this dip will have had an impact on the total number of homes available to buy.
The post-pandemic ‘reassessment of home’ – households deciding to change how and where they live – has further to run, especially as office-based workers receive confirmation about flexible working, allowing more leeway to live further from the office. This means higher levels of demand will still be evident.
However, the lack of supply, especially for family houses, means the market will start to naturally slow during the rest of this year and into next year, as buyers hold on for more stock to become available before making a move.
As we move into 2022, there will be a strong start to the year in line with seasonal trends, but after that, a return to more usual levels of activity among first-time buyers, the effect of the ending of the stamp duty holiday, and some buyers waiting for more stock to become available will result in a slow repairing of stock levels through H1.
Markets moving faster
Higher levels of demand amid constrained supply is not only resulting in price growth, but also homes selling faster, with the average time between listing and sale subject to contract averaging 27 days in July, down from 42 days in July 2016.
Not all markets are moving at the same pace however. It’s taking longer than the average length of time to sell a home in and around London (56 – 75 days), Aberdeen (53 days), Brentwood (49 days), Reading (46 days), Oxford (41 days) and South Bucks (41 days).
In London, this reflects the higher level of supply available (especially flats in the centre of the city) alongside more muted demand in central zones. Aberdeen’s sales market has long been tracking trends in the North Sea oil industry.
In the other slower moving markets, it is notable that price growth is also below average, ranging from 2.5% in Reading to 3.8% in Brentwood.
Demand continues to outstrip supply
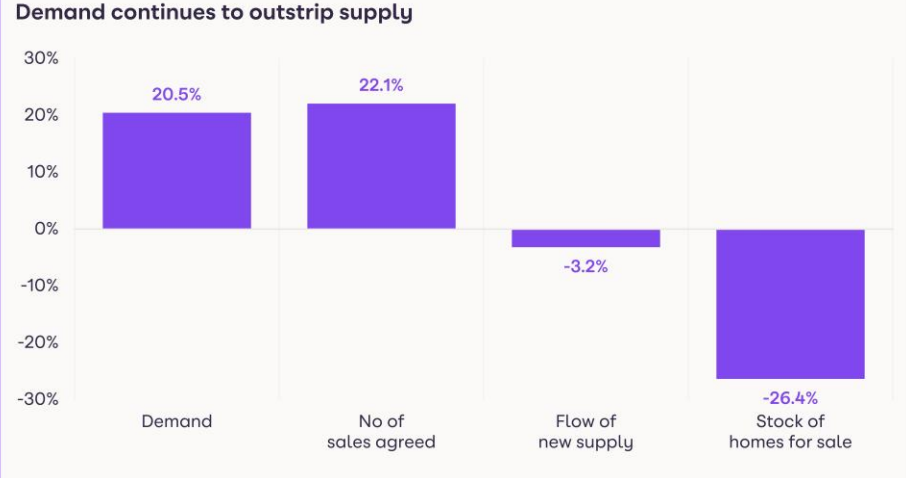
Zoopla House Price Index
Highest price rises in markets with lower average values
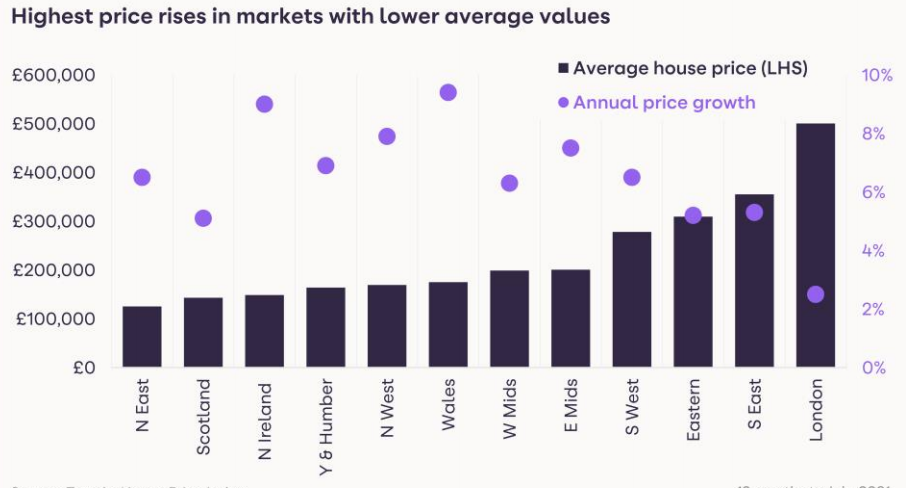
Zoopla House Price Index
Average price growth for houses higher than flats
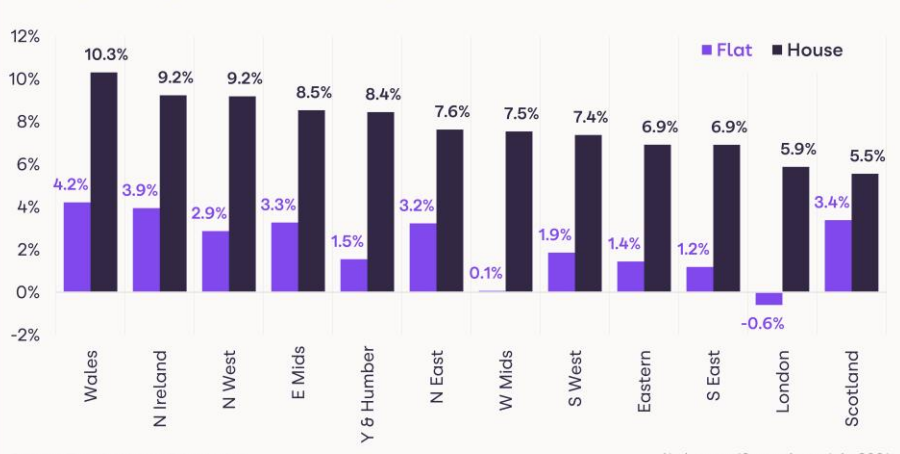
Zoopla House Price Index
Outlook
The low supply of homes listed for sale, especially family houses, and a limited choice for would-be buyers may well impact demand in H2 and into 2022, leading to a natural slowing in buyer interest as buyers looking to move to this type of property wait to find a suitable property before making a move.
Alongside this, the end of the stamp duty holiday, and the changing economic landscape, with the ending of government support, will also slow the market.
However, this will not be sudden, and we believe that the ‘reassessment of home’ has further to run, so overall demand will remain stronger than usual.
This will also support price growth through to the end of the year, which we expect to be at +4% to +5% in December.
While there will be a busy start to 2022, in line with seasonal trends, a return to more normal levels of activity among movers and first-time buyers throughout H2 will result in a slow rebuilding of stock levels.
Kindly shared by Hometrack
Main photo courtesy of Pixabay


