


Average house price falls slightly, the first drop in a year – Halifax House Price Index
Average house price falls slightly, the first drop in a year, according to the latest Halifax House Price Index, covering July.
Key points from Index:
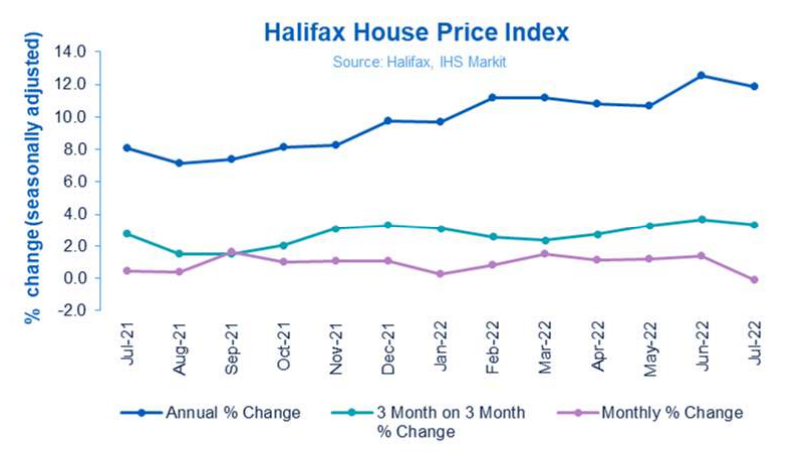
- House prices fell marginally by 0.1% in July – the first decrease since June 2021
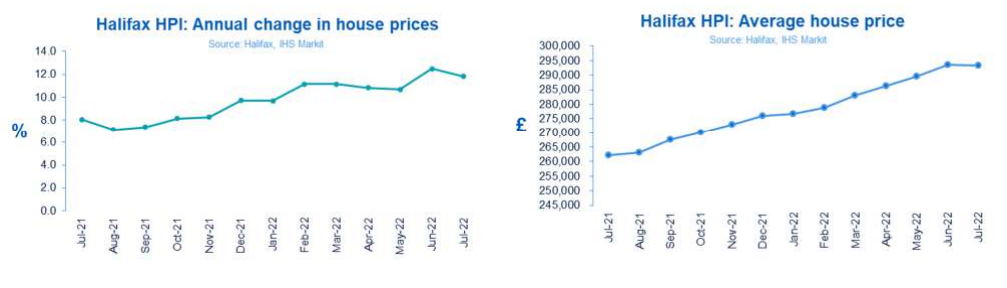
- Annual rate of growth eased to 11.8% (from 12.5%)
- A typical UK property now costs £293,221
- Wales again shows the strongest annual growth in the UK
Russell Galley, Managing Director, Halifax, said:
“Following a year of exceptionally strong growth, UK house prices fell last month for the first time since June 2021, albeit marginally (-0.1%). This left the average house price at £293,221, down £365 from the previous month’s record high. The rate of annual inflation eased slightly (to +11.8%), although it’s important to note that house prices remain more than £30,000 higher than this time last year.
“While we shouldn’t read too much into any single month, especially as the fall is only fractional, a slowdown in annual house price growth has been expected for some time. Leading indicators of the housing market have recently shown a softening of activity, while rising borrowing costs are adding to the squeeze on household budgets against a backdrop of exceptionally high house price-to-income ratios.
“That said, some of the drivers of the buoyant market we’ve seen over recent years – such as extra funds saved during the pandemic, fundamental changes in how people use their homes, and investment demand, still remain evident. The extremely short supply of homes for sale is also a significant long-term challenge but serves to underpin high property prices.
“Looking ahead, house prices are likely to come under more pressure as those market tailwinds fade further and the headwinds of rising interest rates and increased living costs take a firmer hold. Therefore a slowing of annual house price inflation still seems the most likely scenario.”
Buyer type and property type:
First-time buyer annual inflation dropped noticeably to 10.7% in July, from 12.4% in June, and continues to be outstripped by price rises seen for home-movers (+12.0% in July, down from +12.5%).
It remains the case that price gains for bigger houses are noticeably outpacing those for smaller homes. The price of a detached house has leapt by £60,860 (+15.1%) over the last year, compared to £11,962 (+7.7%) for flats.
Regions and nations house prices:
Wales has moved back to the top of the table for annual house price inflation, up by +14.7%, with an average property price of £222,639.
It’s closely followed by the South West of England, which also continues to record a strong rate of annual growth, up by +14.3%, with an average property cost of £310,846.
The rate of annual growth in Northern Ireland eased back slightly to +14.0%, with a typical home now costing £187,102.
Scotland too saw a slight slowdown in the rate of annual house price inflation, to +9.6% from +9.9%. A Scottish home now costs an average of £203,677, another record high for the nation.
While London continues to record slower annual house price inflation than the other UK regions, the rate of +7.9% is the highest in almost five years. With an average property now costing £551,777 the capital’s already record average house price continues to push higher, up by £40,361 over the last year. It remains by far the most expensive place in the country to buy a home.
Housing activity:
- HMRC monthly property transactions data shows UK home sales decreased in June 2022. UK seasonally adjusted (SA) residential transactions in June 2022 were 95,420 – down by 7.9% from May’s figure of 103,650 (down 3.1% on a non-SA basis). Quarterly SA transactions (April-June 2022) were approximately 4.6% lower than the preceding three months (January 2022 – March 2022). Year-on-year SA transactions were 54.3% lower than June 2021 (55.1% lower on a non-SA basis). (Source: HMRC)
- Latest Bank of England figures show the number of mortgages approved to finance house purchases fell in June 2022, by 3% to 63,726. Year-on-year the June figure was 21% below June 2021. (Source: Bank of England, seasonally-adjusted figures)
- The latest RICS Residential Market Survey shows a modest decline in buyer demand during June. The net balance score for new buying enquiries was -27%, down from -9% previously, the second consecutive month in negative territory. Agreed sales have a net balance of -13% (-5% previously) and new instructions returned a net balance score of -1 (previously zero). (Source: Royal Institution of Chartered Surveyors’ (RICS) monthly report)
UK house prices – Historical data:
National: All Houses, All Buyers (Seasonally Adjusted)
| Period | Index
Jan 1992=100 |
Standardised average price
£ |
Monthly change
% |
Quarterly change
% |
Annual change
% |
| July 2021 | 452.1 | 262,200 | 0.5 | 2.8 | 8.0 |
| August | 453.8 | 263,162 | 0.4 | 1.5 | 7.2 |
| September | 461.3 | 267,516 | 1.7 | 1.5 | 7.4 |
| October | 465.9 | 270,184 | 1.0 | 2.0 | 8.2 |
| November | 470.8 | 273,028 | 1.1 | 3.1 | 8.2 |
| December | 475.9 | 275,996 | 1.1 | 3.3 | 9.7 |
| January 2022 | 477.0 | 276,645 | 0.2 | 3.1 | 9.7 |
| February | 480.9 | 278,894 | 0.8 | 2.6 | 11.2 |
| March | 488.0 | 283,001 | 1.5 | 2.4 | 11.1 |
| April | 493.6 | 286,242 | 1.2 | 2.7 | 10.8 |
| May | 499.5 | 289,666 | 1.2 | 3.3 | 10.7 |
| June | 506.3 | 293,586 | 1.4 | 3.7 | 12.5 |
| July | 505.6 | 293,221 | -0.1 | 3.3 | 11.8 |
Kindly shared by Halifax
Main article photo courtesy of Pixabay


