


UK housing market continues to slow – Halifax House Price Index
The UK housing market continues to slow, according to the latest Halifax House Price Index, covering November.
Key points from the publication:
-
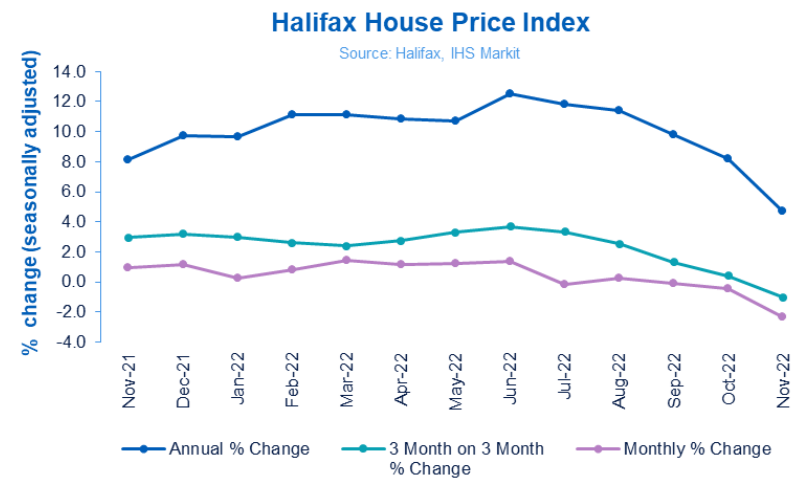
- Average house price fell by -2.3% in November (vs. -0.4% in October)
- Annual rate of growth dropped to +4.7% (from +8.2%)
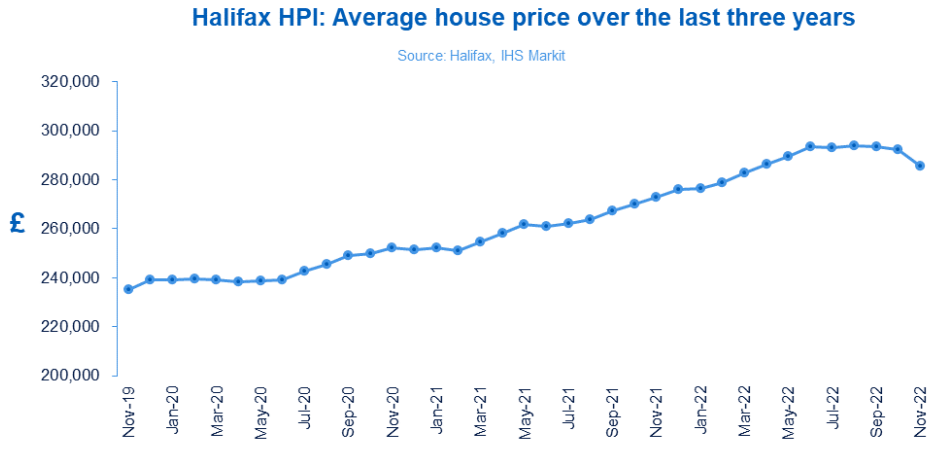
- Typical UK property now costs £285,579 (down from £292,406 last month)
- Rate of annual growth slowed in all but one region (the North-East) during November
- Similar slowing trend in Northern Ireland, Scotland, and Wales
|
Average house price |
Monthly change |
Quarterly change |
Annual change |
|
£285,579 |
-2% |
-1.0% |
+4.7% |
Kim Kinnaird, Director, Halifax Mortgages, said:
“Average house prices fell in November as the rate of annual growth slowed further to +4.7% (from +8.2%), with the typical UK property price now sitting at £285,579. The monthly drop of -2.3% is the largest seen since October 2008 and the third consecutive fall.
“While a market slowdown was expected given the known economic headwinds – and following such extensive house price inflation over the last few years (+19% since March 2020) – this month’s fall reflects the worst of the market volatility over recent months.
“Some potential home moves have been paused as homebuyers feel increased pressure on affordability and industry data continues to suggest that many buyers and sellers are taking stock while the market continues to stabilise.
“When thinking about the future for house prices, it is important to remember the context of the last few years, when we witnessed some of the biggest house price increases the market has ever seen. Property prices are up more than £12,000 compared to this time last year, and well above pre-pandemic levels (+£46,403 vs March 2020).
“The market may now be going through a process of normalisation. While some important factors like the limited supply of properties for sale will remain, the trajectory of mortgage rates, the robustness of household finances in the face of the rising cost of living, and how the economy – and more specifically the labour market – performs will be key in determining house prices changes in 2023.”
Nations and regions house prices:
The slowing market is reflected across the UK, with most nations and regions seeing the rate of annual house price inflation fall last month.
The only exception remains the North East of England, which saw its rate of annual growth edge up slightly to +10.5% (from +10.4%). It’s also now the only area of the UK with annual house price inflation in double figures, with an average property price of £173,587.
Wales (+7.9%, average price of £220,689) and the South West (+8.4%, average price of £307,750) have seen the sharpest slowdown of annual growth (from +11.5% and +10.7% respectively). This is notable given both were key hotspots of house price inflation during the pandemic, suggesting that previous drivers of the market such as the race for space and heightened demand for rural living are now receding.
Scotland has also seen its pace of annual house price inflation continue to slow, now at +6.5% (from +7.4%) with a typical property now costing £203,132.
House prices in Northern Ireland are up +9.1% year-on-year, easing back from +9.7% last month, with an average property price of £185,097.
The pace of annual property price inflation also slowed in London, which continues to lag the other UK regions and nations. House prices have risen +5.2% over the last 12 months, down from +6.6%. The average property price in the capital remains well above the UK average at £549,160.
Housing activity:
-
- HMRC monthly property transaction data shows UK home sales increased in October 2022. UK seasonally adjusted (SA) residential transactions in October 2022 were 108,480 – up by 2.3% from September’s figure of 106,040 (down 3.1% on a non-SA basis). Quarterly SA transactions (August-October 2022) were approximately 2.3% higher than the preceding three months (May 2022 – July 2022). Year-on-year SA transactions were 38.0% higher than October 2021 (29.1% higher on a non-SA basis). (Source: HMRC)
- Latest Bank of England figures show the number of mortgages approved to finance house purchases decreased in October 2022, by 10.6% to 58,977. Year-on-year the October figure was 15.1% below October 2021. (Source: Bank of England, seasonally-adjusted figures)
- The October 2022 RICS Residential Market Survey results point to a continued downward trend in market conditions. New buyer enquiries fell for a sixth month in a row to a net balance of -55%, compared to -36% previously. Agreed sales had a net balance of -45% (-29% previously) and new instructions returned a net balance of -17% (previously -13%). (Source: Royal Institution of Chartered Surveyors’ (RICS) monthly report)
UK house prices Historical data National: All Houses, All Buyers (Seasonally Adjusted):
|
Period |
Index Jan 1992=100 |
Standardised average price £ |
Monthly change % |
Quarterly change % |
Annual change % |
|
November |
470.4 |
272,778 |
0.9 |
3.0 |
8.1 |
|
December |
475.9 |
275,996 |
1.2 |
3.2 |
9.7 |
|
January 2022 |
477.0 |
276,645 |
0.2 |
3.0 |
9.7 |
|
February |
480.9 |
278,894 |
0.8 |
2.6 |
11.2 |
|
March |
488.0 |
283,001 |
1.5 |
2.4 |
11.1 |
|
April |
493.6 |
286,242 |
1.2 |
2.8 |
10.8 |
|
May |
499.5 |
289,666 |
1.2 |
3.3 |
10.7 |
|
June |
506.3 |
293,586 |
1.4 |
3.7 |
12.5 |
|
July |
505.5 |
293,173 |
-0.1 |
3.3 |
11.8 |
|
August |
507.0 |
293,992 |
0.3 |
2.5 |
11.4 |
|
September |
506.4 |
293,664 |
-0.1 |
1.3 |
9.8 |
|
October |
504.2 |
292,406 |
-0.4 |
0.4 |
8.3 |
|
November |
492.5 |
285,579 |
-2.3 |
-1.0 |
4.7 |
Kindly shared by Halifax
Main article photo courtesy of Pixabay


