


UK house prices rise steeply to reach new record high – Halifax House Price Index
UK house prices rise steeply to reach new record high, as market maintains momentum, according to the latest Halifax House Price Index, covering March.
Key points from the publication:
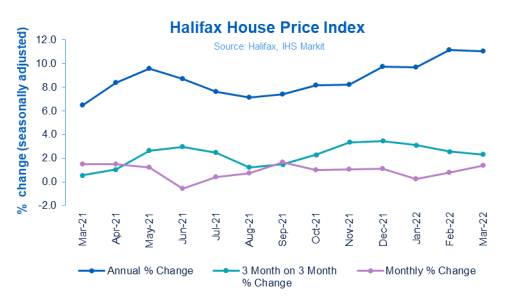
- Monthly house price growth of 1.4% the biggest increase for six months
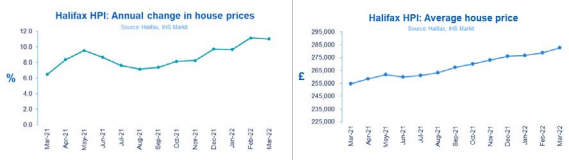
- Average property price reaches another new record high of £282,753
- Two years on from the first lockdown, house prices have now risen by £43,577
- South West overtakes Wales as UK area with strongest house price inflation
- Cost of living pressure likely to slow the rate of house price growth this year
| Average house price
£282,753 |
Monthly change
+1.4% |
Quarterly change
+2.3% |
Annual change
+11.0% |
Russell Galley, Managing Director, Halifax, said:
“Average UK house prices rose again in March for the ninth month in a row. The increase of 1.4%, or £3,860 in cash terms, was the biggest jump since last September. With 2021’s strong momentum continuing into the beginning of this year, the annual rate of house price inflation (+11.0%) continues to track around its highest level since mid-2007. The new record price of £282,753 is up some £28,113 on a year ago, not far off average UK earnings over the same period (£28,860).
“The story behind such strong house price inflation remains unchanged: limited supply and strong demand, despite the prospect of increasing pressure on households’ finances. Although there is some recent evidence of more homes coming onto the market, the fundamental issue remains that too many buyers are chasing too few properties. The effect on house prices makes it increasingly difficult for first-time buyers looking to make their first step onto the ladder, but also challenges homemovers who face ever bigger leaps to move up the rungs to a larger property.
“However, in the long-term we know the performance of the housing market remains inextricably linked to the health of the wider economy. There is no doubt that households face a significant squeeze on real earnings, and the difficulty for policy-makers in needing to support the economy yet contain inflation is now even more acute because of the impact of the war in Ukraine.
“Buyers are therefore dealing with the prospect of higher interest rates and a higher cost of living. With affordability metrics already extremely stretched, these factors should lead to a slowdown in house price inflation over the next year.”
Lockdown: two years on:
March 2022 marked two years since the UK first entered lockdown. At that time, faced with huge levels of economic uncertainty, few could have anticipated just how resilient the housing market would prove to be.
Overall, the average house price has risen by 18.2% over that period, or £43,577 in cash terms. This has taken the national average house price from £239,176 in March 2020 to £282,753 in March 2022.
The impact of the pandemic on buyer demand can be seen most clearly when looking at different property types. With a premium now put on those properties offering greater space – both indoors and out – prices for flats have increased by 10.6% or £15,404 over the last two years. Compare this to the average price of a detached property which has leapt by 21.3% or £77,717 over the same period.
Regions and nations house prices:
The South West of England has overtaken Wales as the UK’s strongest performer in terms of annual price house inflation, now up to 14.6%, its highest rate of annual increase since September 2004. The average house price is now £298,162, a record for the region.
While this is the first time since January 2021 that Wales has not recorded the UK’s highest annual growth, house price inflation remains extremely strong, at 14.1%. The average house price is £211,942 which is yet another all-time high for the country.
Property prices in Northern Ireland also continue to be on the rise, with annual growth now at 13%, and an average price of £177,265.
Though house prices also edged up once more in Scotland – reaching a new record of £194,621 – the rate of annual growth continues to slow somewhat, falling to 8.2% from 9.3% last month.
Elsewhere, the South East also recorded a big increase, with house price growth at 11.6% and an average price of £385,790. Prices in the region have now risen by £40,177 over the last year, the first time any English region outside of London has ever posted a £40,000-plus rise over just 12 months.
London itself continued its recent upward trend, with prices now up by 5.9% year-on-year, with an average price of £534,977.
Housing activity:
- HMRC monthly property transactions data shows UK home sales increased in February 2022. UK seasonally adjusted (SA) residential transactions in February 2022 were 112,240 – up by 4.4% from January’s figure of 107,490 (up 15.3% on a non-SA basis). Quarterly SA transactions (December-February 2022) were approximately 4.8% lower than the preceding three months (September 2021-November 2021). Year-on-year SA transactions were 20.8% lower than February 2021 (20.6% lower on a non-SA basis). (Source: HMRC)
- Latest Bank of England figures show the number of mortgages approved to finance house purchases fell in February 2022, by 4% to 70,993. Year-on-year the February figure was 18% below February 2021. (Source: Bank of England, seasonally-adjusted figures)
- In the latest RICS Residential Market Survey, a net balance of +17% respondents cited an increase in new buyer demand during February – a sixth consecutive month in positive territory (previously +14%). Agreed sales moved into positive territory for the first time since May 2021, with the latest net balance standing at +9% (compared to – 1% previously). New instructions however remain in negative territory for an eleventh consecutive month at -4% (- 7% previously). (Source: Royal Institution of Chartered Surveyors’ (RICS) monthly report)
UK house prices – Historical data National: All Houses, All Buyers (Seasonally Adjusted):
| Period | Index
Jan 1992=100 |
Standardised Average Price
£ |
Monthly change
% |
Quarterly change
% |
Annual change
% |
| March 2021 | 439.1 | 254,640 | 1.5 | 0.6 | 6.5 |
| April | 445.7 | 258,472 | 1.5 | 1.1 | 8.4 |
| May | 451.2 | 261,642 | 1.2 | 2.7 | 9.6 |
| June | 448.5 | 260,099 | -0.6 | 3.0 | 8.7 |
| July | 450.4 | 261,165 | 0.4 | 2.5 | 7.6 |
| August | 453.8 | 263,162 | 0.8 | 1.2 | 7.2 |
| September | 461.3 | 267,516 | 1.7 | 1.5 | 7.4 |
| October | 465.9 | 270,184 | 1.0 | 2.3 | 8.2 |
| November | 470.8 | 273,028 | 1.1 | 3.4 | 8.2 |
| December | 475.9 | 275,996 | 1.1 | 3.5 | 9.7 |
| January 2022 | 477.0 | 276,645 | 0.2 | 3.1 | 9.7 |
| February | 480.9 | 278,894 | 0.8 | 2.6 | 11.2 |
| March | 487.6 | 282,753 | 1.4 | 2.3 | 11.0 |
Kindly shared by Halifax
Main article photo courtesy of Pixabay


