


UK House Price Index May 2020 from HM Land Registry
The UK House Price Index May 2020 data shows that, on average, UK average house prices increased by 2.9% over the year to May 2020.
Main points
- UK average house prices increased by 2.9% over the year to May 2020, up from 2.7% in April 2020.
- Average house prices increased over the year in England to £252,000 (2.9%), Wales to £169,000 (4.8%), Scotland to £155,000 (2.1%) and Northern Ireland to £141,000 (3.8%).
- London’s average house price increased by 3.3% over the year to May 2020.
- The UK House Price Index (HPI) is based on completed housing transactions; typically, a house purchase can take six to eight weeks to reach completion, therefore, the price data feeding into the May 2020 UK HPI will mainly reflect those agreements that occurred before the government measures to reduce the spread of the coronavirus (COVID-19) took hold.
- The Office for National Statistics (ONS) has released a public statement on the coronavirus (COVID-19) and the production of statistics
UK house prices
UK average house prices increased by 2.9% over the year to May 2020
The UK House Price Index (HPI) is based on completed housing transactions. Typically, a house purchase can take six to eight weeks to reach completion. Therefore, the price data feeding into the May 2020 UK HPI will mainly reflect those agreements that occurred before the government measures to reduce the spread of the coronavirus (COVID-19) took hold.
Given the impact of the coronavirus on the availability and supply of housing transactions, we may see larger than usual revisions to our provisional estimates over the next few months, as more transactions become available with which we can calculate the HPI. More information on this can be found in Measuring the data.
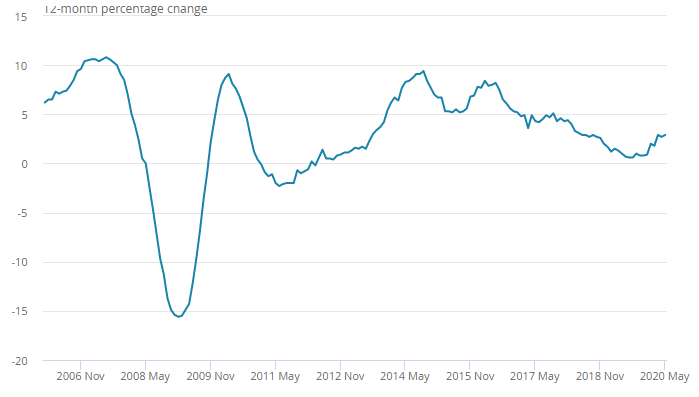
The latest house price data published on GOV.UK by HM Land Registry for May 2020 show that average house prices in the UK increased by 2.9% in the year to May 2020, up from 2.7% in the year to April 2020 (Figure 1).
Over the past three years, there has been a general slowdown in UK house price growth, driven mainly by a slowdown in the south and east of England, but there has been a pickup in annual growth since December 2019.
Figure 1: House price growth in the UK has generally slowed since mid-2016, but has picked up in recent months
Annual house price rates of change for all dwellings, UK, January 2006 to May 2020
Source: HM Land Registry, Registers of Scotland, Land and Property Services Northern Ireland, Office for National Statistics – UK House Price Index
Notes:
- Not seasonally adjusted.
- The full UK House Price Index (HPI) release is available to download from HM Land Registry at GOV.UK.
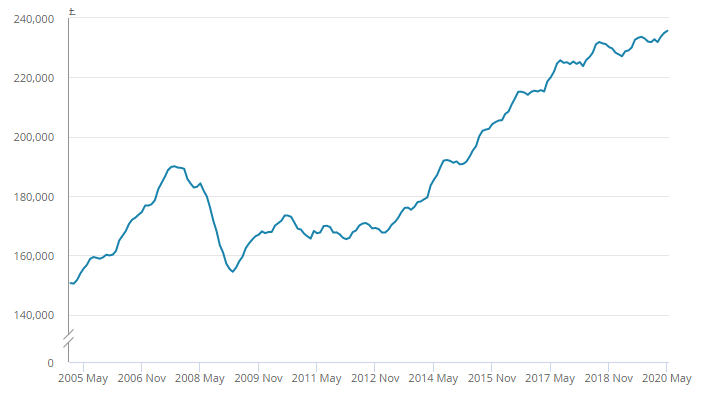
Figure 2: Average UK house prices peaked at £236,000 in May 2020
Average house price, UK, January 2005 to May 2020
Source: HM Land Registry, Registers of Scotland, Land and Property Services Northern Ireland, Office for National Statistics – UK House Price Index
Notes:
- Not seasonally adjusted.
- The full UK House Price Index (HPI) release is available to download from HM Land Registry at GOV.UK.
The average UK house price was £236,000 in May 2020; this is £7,000 higher than in May 2019 (Figure 2).
On a non-seasonally adjusted basis, average house prices in the UK increased by 0.3% between April 2020 and May 2020, compared with an increase of 0.1% in the same period a year ago.
On a seasonally adjusted basis, average house prices in the UK increased by 0.2% between April 2020 and May 2020, following a decrease of 0.2% in the previous month.
House prices by country
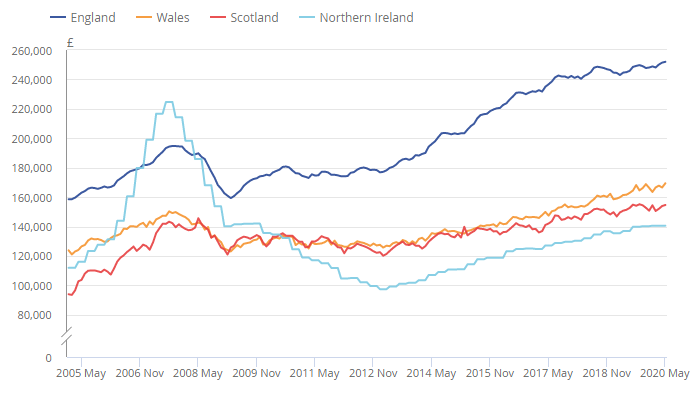
Figure 3: England house prices remain the highest in the UK
Average house price by country, UK, January 2005 to May 2020
Source: HM Land Registry, Registers of Scotland, Land and Property Services Northern Ireland, Office for National Statistics – UK House Price Index
Notes:
- Not seasonally adjusted.
- The full House Price Index (HPI) release is available to download from HM Land Registry at GOV.UK.
- Northern Ireland data are only available on a quarterly basis. Northern Ireland data are copied forward until the next quarter’s data are available, which will be in the June 2020 bulletin released on 16 September 2020.
House price growth in Wales increased by 4.8% over the year to May 2020, up from 3.2% in April 2020, with the average house price in Wales at £169,000.
The average house price in England increased by 2.9% over the year to May 2020, up from 2.8% in the year to April 2020, with the average house price in England now at £252,000.
The average house price in Scotland increased by 2.1% over the year to May 2020, unchanged since April 2020, with the average house price in Scotland now at £155,000.
The average house price in Northern Ireland increased by 3.8% over the year to Quarter 1 (January to March) 2020. Northern Ireland remains the cheapest UK country to purchase a property in, with the average house price at £141,000 (Figure 3).
House prices by region
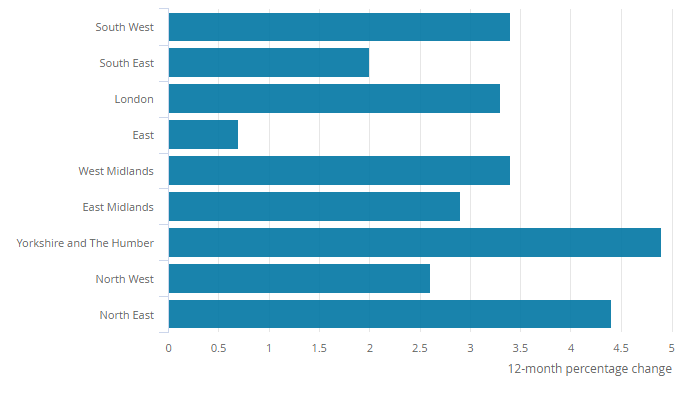
Figure 4: The strongest regional growth was in Yorkshire and The Humber
All dwellings annual house price rates of change, by English region, year to May 2020
Source: HM Land Registry and Office for National Statistics – UK House Price Index
Notes:
- Not seasonally adjusted.
- The full UK House Price Index (HPI) release is available to download from HM Land Registry at GOV.UK.
Yorkshire and The Humber was the English region with the highest annual house price growth, with prices increasing by 4.9% to £170,000 in the year to May 2020, up from 2.0% in April 2020 (Figure 4).
The lowest annual growth was in the East of England, where prices increased by 0.7% over the year to May 2020.
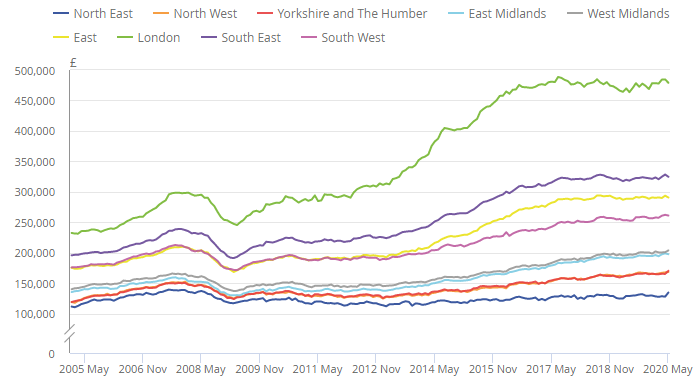
London house prices remain the most expensive at an average of £479,000. The North East continued to have the lowest average house price, at £135,000, and is the only English region yet to surpass its pre-economic downturn peak of July 2007 (Figure 5).
Figure 5: London continues to have the highest average house price in England
Average house price, by English region, January 2005 to May 2020
Source: HM Land Registry and Office for National Statistics – UK House Price Index
Notes:
- Data at the local authority level and other breakdowns can be found in the full House Price Index (HPI) release, available to download from HM Land Registry at GOV.UK.
House Price Index data
UK House Price Index
Dataset | Released 2 September 2020
Monthly house price movements, including average price by property type, sales and cash mortgage sales, as well as information on first-time buyers, new builds and former owner occupiers. Data are collected by HM Land Registry and published on GOV.UK.
House price data: quarterly tables
Dataset | Released 19 August 2020
Quarterly house price data based on a sub-sample of the Regulated Mortgage Survey.
House price data: annual tables 20 to 39
Dataset | Released 19 August 2020
Annual house price data based on a sub-sample of the Regulated Mortgage Survey.
Glossary
House Price Index (HPI)
The House Price Index (HPI) measures the price changes of residential housing as a percentage change from a specific time period (12 months prior or a base period, where HPI equals 100).
House price inflation
House price inflation in the UK is the rate at which the prices of residential properties purchased in the UK rise and fall.
Non-seasonally adjusted
A non-seasonally adjusted series is one that includes seasonal or calendar effects.
Seasonally adjusted
A seasonally adjusted series is one that has been subject to a widely used technique for removing seasonal or calendar effects from time series data.
Measuring the data
The UK House Price Index (HPI) is a joint production by HM Land Registry, Registers of Scotland, Land and Property Services Northern Ireland, and the Office for National Statistics (ONS). HM Land Registry publishes the main publication of the UK HPI on the GOV.UK website today (9:30am, 2 September 2020). It includes full details, including commentary, historical data tables and analytical tools.
Coronavirus
The ONS is working to ensure that the UK has the vital information needed to respond to the impact of the coronavirus (COVID-19) pandemic on our economy and society, this includes how we measure the UK House Price Index.
Because of the impact of the coronavirus (COVID-19) pandemic on both the number and supply of housing transactions, some methodology changes have been made. The processing of new build properties has been more affected than the processing of “old build” properties, and a lower number of transactions took place in April and May 2020 than usual. So, in order to address these issues, we have had to attempt to smooth some of the estimates to reduce volatility by pooling transactions for certain months:
- March 2020 includes new build transactions from both February 2020 and March 2020 for England and Wales
- April 2020 includes all transactions from both March 2020 and April 2020 for England, Scotland and Wales
- because of the nature of the processing of the first estimate, May 2020 has not been affected
These changes might lead to larger revisions to published estimates than usual as we reduce the reliance on pooling and the supply of housing transactions return to more normal levels. Further information on how we usually process the new build properties can be found in the Quality and methodology documentation.
The ONS remains committed to providing the best and most accurate information we can, serving the public good at a time when it is needed the most. We will be working to a publication schedule, detailed in this section, that will see us publish interim releases with a view to resuming normal publication in October with the publication of the August 2020 index. This schedule will ensure we can use as many transactions as possible in each of the suspended periods following the issues caused by the coronavirus pandemic.
As per our usual revisions policy, the figures for all months are first estimates and are subject to revision in subsequent periods.
Provisional publication schedule:
- 2 September – May 2020 index
- 16 September – June 2020 index
- 7 October – July 2020 index
- 21 October – August 2020 index
The ONS has released a public statement on COVID-19 and the production of statistics. Specific queries must be directed to the Media Relations Office.
After EU withdrawal
As the UK leaves the EU, it is important that our statistics continue to be of high quality and are internationally comparable. During the transition period, those UK statistics that align with EU practice and rules will continue to do so in the same way as before 31 January 2020.
After the transition period, we will continue to produce our inflation statistics in line with the UK Statistics Authority’s Code of Practice for Statistics and in accordance with internationally agreed statistical guidance and standards.
Data sources
The main sources of data used in the UK are HM Land Registry for England and Wales, Registers of Scotland, and HM Revenue and Customs’ (HMRC’s) Stamp Duty Land Tax data for the Northern Ireland HPI.
Kindly shared by HM Land Registry
Main article photo courtesy of Pixabay


