


UK House Price Index June 2020 from the Office for National Statistics
The UK House Price Index June 2020 data shows that, on average, UK average house prices increased by 3.4% over the year to June 2020.
Main points:
- UK average house prices increased by 3.4% over the year to June 2020, up from 1.1% in May 2020.
- Average house prices increased over the year in England to £254,000 (3.5%), Wales to £168,000 (2.8%), Scotland to £157,000 (2.9%) and Northern Ireland to £141,000 (3.0%).
- London’s average house prices increased by 4.2% over the year to June 2020.
- The Office for National Statistics (ONS) has released a public statement on the coronavirus (COVID-19) and the production of statistics; Measuring the data describes the situation in relation to the UK House Price Index (HPI).
UK house prices
UK average house prices increased by 3.4% over the year to June 2020
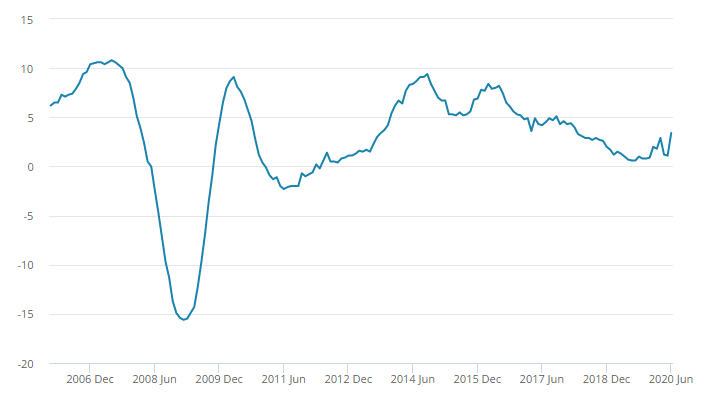
The latest house price data published on GOV.UK by HM Land Registry for June 2020 show that average house prices in the UK increased by 3.4% in the year to June 2020, up from 1.1% in the year to May 2020 (Figure 1).
Over the past three years, there has been a general slowdown in UK house price growth, driven mainly by a slowdown in the south and east of England. The beginning of 2020 saw a pick up in annual growth in the housing market before the coronavirus (COVID-19) restrictions were put in place at the end of March 2020.
Because of the impact of the coronavirus (COVID-19) pandemic on both the number and supply of housing transactions, we might see larger revisions to the published House Price Index estimates than usual. Further information on this can be found in Measuring the data.
Figure 1: Since November 2017, UK house price growth has been consistently below 5%
Annual house price rates of change for all dwellings, UK, January 2006 to June 2020
Source: HM Land Registry, Registers of Scotland, Land and Property Services Northern Ireland, Office for National Statistics – UK House Price Index
Notes:
- Not seasonally adjusted.
- The full UK House Price Index (HPI) release is available to download from HM Land Registry at GOV.UK.
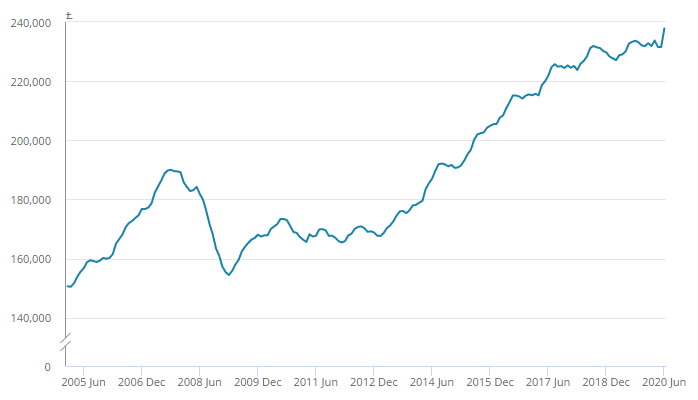
Figure 2: Average UK house prices peaked at £238,000 in June 2020
Average house price, UK, January 2005 to June 2020
Source: HM Land Registry, Registers of Scotland, Land and Property Services Northern Ireland, Office for National Statistics – UK House Price Index
Notes:
- Not seasonally adjusted.
- The full UK House Price Index (HPI) release is available to download from HM Land Registry at GOV.UK.
The average UK house price was £238,000 in June 2020; this is £8,000 higher than in June 2019 (Figure 2).
On a non-seasonally adjusted basis, average house prices in the UK increased by 2.7% between May 2020 and June 2020, compared with an increase of 0.4% in the same period a year ago.
On a seasonally adjusted basis, average house prices in the UK increased by 2.4% between May and June 2020, following a decrease of 0.1% in the previous month.
This increase may partly reflect the unusual conditions in the housing market during the coronavirus (COVID-19) pandemic and movement restrictions put in place from 23 March 2020. People were advised not to move house during the tightest restrictions. As such, property transactions completed during that time may have been more concentrated than usual among those without complicating factors such as a chain. For example, first-time buyers may have been freer to complete transactions than former owner occupiers, who may have had to co-ordinate multiple sales during lockdown and would also typically be at the lower end of the price scale than former owner occupiers.
Data from UK Finance indicate that purchases by former owner occupiers fell the most in April 2020, at 61% on the year, compared with a fall of 53% for first-time buyers and 54% for buy-to-let purchases. UK Finance data also show larger differences between first-time buyer and former owner occupier purchases for Quarter 2 (Apr to June) 2020 in regions where the House Price Index (HPI) shows the largest price falls.
The increase in prices in June 2020 may reflect some degree of pent-up demand following the easing of lockdown restrictions, particularly at the higher end of the price scale.
House prices by country
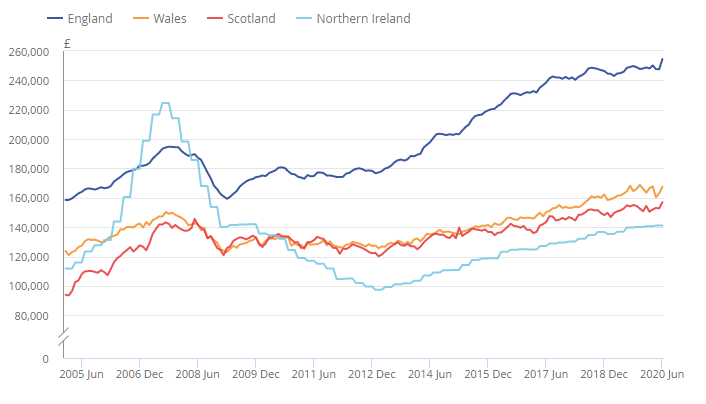
Figure 3: England house prices remain the highest in the UK
Average house price by country, UK, January 2005 to June 2020
Source: HM Land Registry, Registers of Scotland, Land and Property Services Northern Ireland, Office for National Statistics – UK House Price Index
Notes:
- Not seasonally adjusted.
- The full House Price Index (HPI) release is available to download from HM Land Registry at GOV.UK.
- Northern Ireland data are only available on a quarterly basis. Northern Ireland data are copied forward until the next quarter’s data are available, which will be in the September 2020 bulletin released on 18 November 2020.
The average house price in England increased by 3.5% over the year to June 2020, up from 1.1% in the year to May 2020, with the average house price in England now at £254,000.
The average house price in Scotland increased by 2.9% over the year to June 2020, up from 0.9% in the year to May 2020, with the average house price in Scotland now at £157,000.
House price growth in Wales increased by 2.8% over the year to June 2020, up from 0.9% in May 2020, with the average house price in Wales now at £168,000.
The average house price in Northern Ireland increased by 3.0% over the year to Quarter 2 (Apr to June) 2020. Northern Ireland remains the cheapest UK country to purchase a property in, with the average house price at £141,000 (Figure 3).
House prices by region
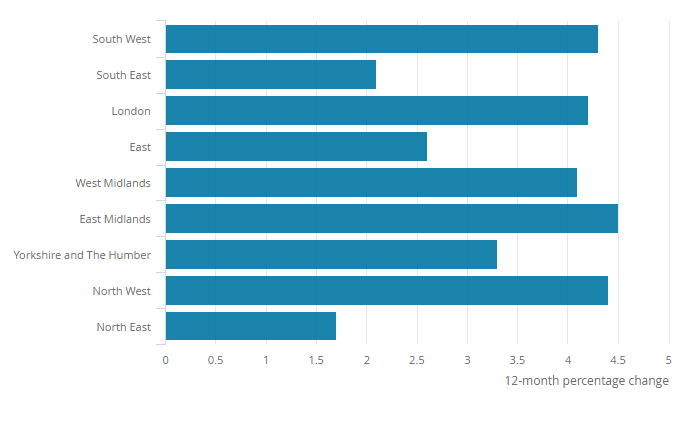
Figure 4: The strongest regional growth was in the East Midlands
All dwellings annual house price rates of change, by English region, year to June 2020
Source: HM Land Registry and Office for National Statistics – UK House Price Index
Notes:
- Not seasonally adjusted.
- The full UK House Price Index (HPI) release is available to download from HM Land Registry at GOV.UK.
The East Midlands was the English region with the highest annual house price growth, with prices increasing by 4.5% to £201,000 in the year to June 2020, up from 1.9% in May 2020 (Figure 4).
The lowest annual growth was in the North East, where prices increased by 1.7% over the year to June 2020.
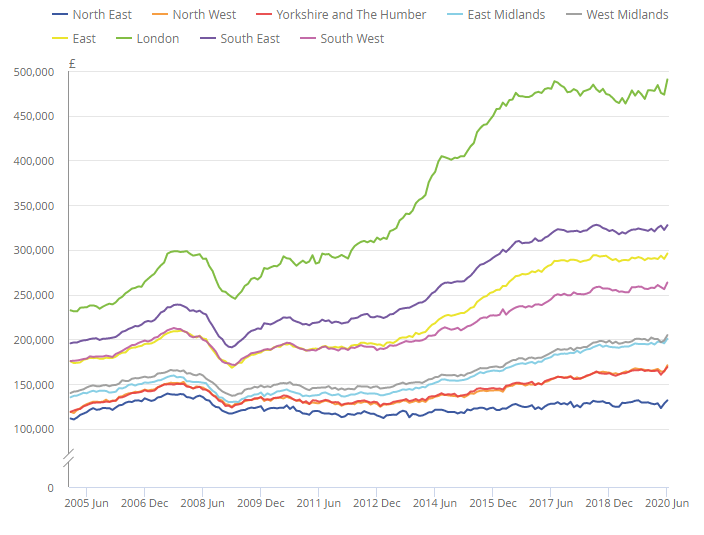
London house prices remain the most expensive at an average of £490,000. The North East continued to have the lowest average house price, at £132,000, and is the only English region yet to surpass its pre-economic downturn peak of July 2007 (Figure 5).
Figure 5: London continues to have the highest average house price in England
Average house price, by English region, January 2005 to June 2020
Source: HM Land Registry and Office for National Statistics – UK House Price Index
Notes:
- Data at the local authority level and other breakdowns can be found in the full House Price Index (HPI) release, available to download from HM Land Registry at GOV.UK.
House Price Index data
UK House Price Index
Dataset | Released 16 September 2020
Monthly house price movements, including average price by property type, sales and cash mortgage sales, as well as information on first-time buyers, new builds and former owner occupiers. Data are collected by HM Land Registry and published on GOV.UK.
House price data: quarterly tables
Dataset | Released 19 August 2020
Quarterly house price data based on a sub-sample of the Regulated Mortgage Survey.
House price data: annual tables 20 to 39
Dataset | Released 19 August 2020
Annual house price data based on a sub-sample of the Regulated Mortgage Survey.
Kindly shared by Office for National Statistics (ONS)
Main article photo courtesy of Pixabay


