


UK Cities House Price Index published for December 2018
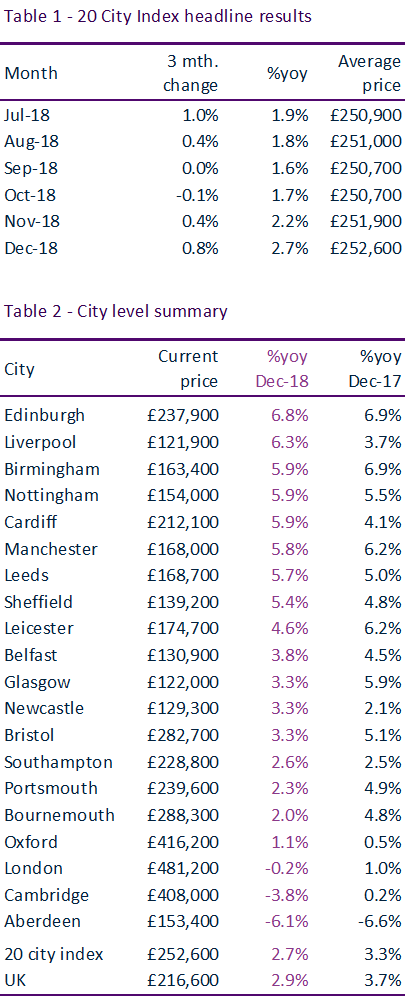
The 20-city index is registering house price inflation of 2.7%, half the average annual rate over the last 5 years, and slower growth is largely a result of material slowdown in London and other cities in southern England since 2016.
- UK city house price inflation 2.7%, half the average annual rate over the last 5 years
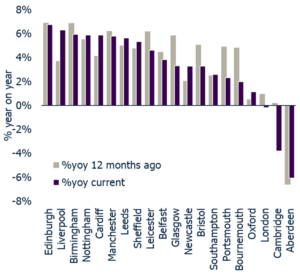
- Price growth ranges from +7% in Edinburgh to -6% in Aberdeen
- Ten cities have recorded double digit price growth of up to 16% since the Brexit vote in June 2016, led by Birmingham and Manchester.
London a drag on 20-city index headline growth
City house price growth has slowed steadily over 2018 and is currently running at 2.7%. This is less the half the annual growth rate over the last 5 years (6.0%).
Slower growth in the 20-city composite index is largely a result of material slowdown in London and other cities in southern England since 2016. The London City index – which includes the commuter areas around London – is registering price falls of 0.2%. The annual growth rate has been negative for almost a year.
City growth ranges from -6% to +7%
Prices are also falling in London (-0.2), Aberdeen (-6.1%) and Cambridge (-3.8%). Prices are rising across the remaining 17 cities with the fastest growth in Edinburgh (6.8%) followed by Liverpool (6.1%).
City price inflation have varied widely
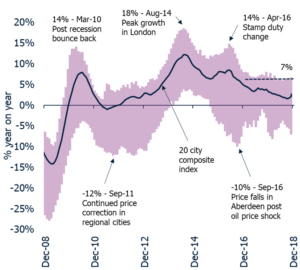
Figure 2 puts the recent slowdown in context, tracking the development of house price inflation over the last decade. It shows the spread between the highest and lowest growth rates for city house prices along with the headline growth rate for the 20-city composite index.
Acceleration in city price growth pre-2016
London led the post-recession bounce back in 2010 and reached 18% annual growth in August 2014 (Fig.2). This was followed by a further acceleration to 14% in April 2016 as demand spiked ahead of changes to stamp duty. Regional cities outside south east England have topped the growth rankings over the last 2 years with the maximum growth rate averaging 7% per annum.
A two-year window with no price falls
Several large cities experienced price falls up until the end of 2012 on rising unemployment and falling incomes. There was a relatively short, two-year window between 2013 and 2015 when all 20 cities registered price rises. This ended in 2015 as the collapse in oil prices resulted in house price falls in Aberdeen.
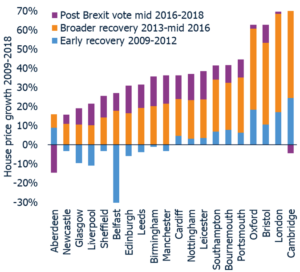
Development of price growth 2009-2018
The development of city house price growth has split into three distinct phases – the early recovery from 2009-2012, broader recovery 2013 to mid-2016 and the post Brexit vote period from mid-2016 to end-2018. Figure 3 and Table 3 show growth by period and city. London, Oxford and Cambridge led the recovery, but price inflation has stalled on stretched affordability and multiple tax changes. Regional cities continue to register above average price growth as employment rises and mortgage rates remain low. Ten cities have recorded double digit price growth since June 2016, led by Birmingham (16%) and Manchester (15%).
Sales and mortgage volumes broadly flat
While price trends are the focus for home owners, transaction volumes are more important for business operating in the market. National data from HMRC shows housing transactions down slightly (2%) over 2018 but in line with the average over the last 5 years. Similarly, Bank of England data on the number of mortgage approvals for those looking to buy a home are in line with the average over the last 5 years. There are regional variations to market activity. Most notably the slowdown in London price growth has been accompanied by a double-digit decline in sales volumes although transaction levels appear to have stabilised. Regional cities continue to register increased sales volumes, offsetting weakness in southern England.
Buyers shrug off Brexit uncertainty
As the debate around Brexit intensifies there has been renewed focus on what this means for the housing market. It is clear from the transactional data that households are continuing to buy property at a steady rate and the impetus for growth in both activity and prices is focused in regional housing markets.
London price falls a result of market fundamentals
It remains our view that housing market fundamentals explain the slowdown in London with Brexit uncertainty a compounding factor for the slowdown in London. We expect average prices across London to decline by 2% in 2019 with price falls concentrated in central London where annual growth is currently -4%. Prices continue to post small gains in the more affordable areas of outer London.
First-time buyers an important boost to demand
Prices are set to continue growing at an above average rate in regional cities over 2019 with the highest growth rates in cities where the jobs market is strong. At a national level, first-time buyers look set to overtake existing homeowners as the largest group of home buyers in 2018. We expect first time buyers to be the largest buyer group in 2019. This group are an important source of housing demand in regional cities where affordability is less of a barrier to home ownership than in south Eastern England.
Kindly shared by Hometrack


