


UK Cities House Price Index – March 2018 (headlines)
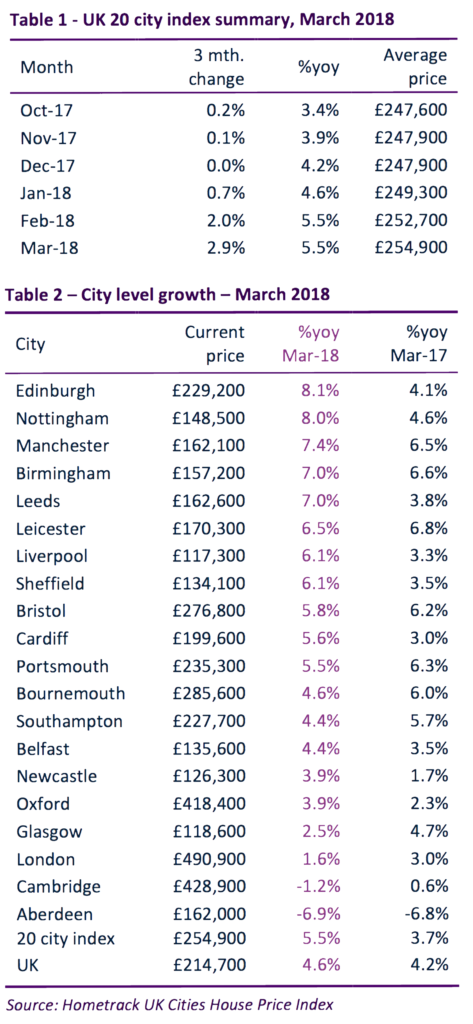
UK cities house price inflation running at 5.5%, while growth ranges from +8.1% in Edinburgh to -6.6% in Aberdeen, and Cambridge the only other city with price falls, and signs that downward pressure on prices in London is easing.
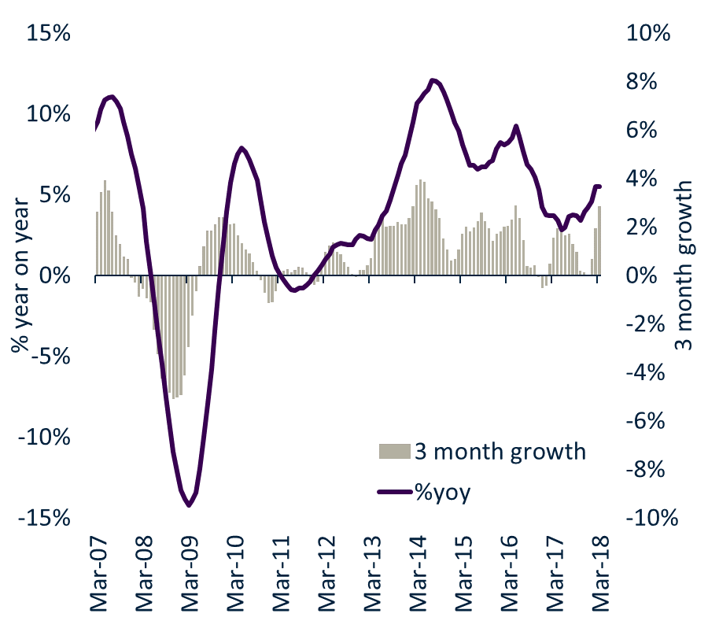
- UK city house price inflation running at 5.5%, up from 3.7% a year ago.
- Growth ranges from +8.1% in Edinburgh to -6.6% in Aberdeen. Cambridge only other city with price falls.
- Signs that downward pressure on prices in London is easing on seasonal rise in activity and price reductions. Turnover looks set to stabilise in 2018 having fallen almost 20% since 2014.
- Regional cities continue to drive headline house price growth while in London there are signs that the downward pressure on prices is starting to ease on a seasonal increase in activity.
City house price growth running at 5.5%
UK city house price inflation was +5.5% in the 12 months to March 2018, up from 3.7% a year earlier. The annual rate of growth ranges from +8.1% in Edinburgh to -6.6% in Aberdeen with Cambridge the only other city registering nominal price falls (-1.2%).
Growth rate jumps across four cities
Cardiff, Leeds, Newcastle and Sheffield have all recorded a sustained upward shift in the annual rate of growth over the last 12 months (Table 2). Capital growth in these cities has under-performed that recorded across the larger regional cities over the last two years. The increased rate of growth is a result of rising demand and a lack of housing for sale.
Seasonal increase in sales agreed across all cities
Analysis of property listings data from Zoopla reveals the usual, seasonal increase in housing sales being agreed over the first three and a half months of the year. This is across all cities, including London where early indications suggest the uplift in sales appears slightly higher than last year.
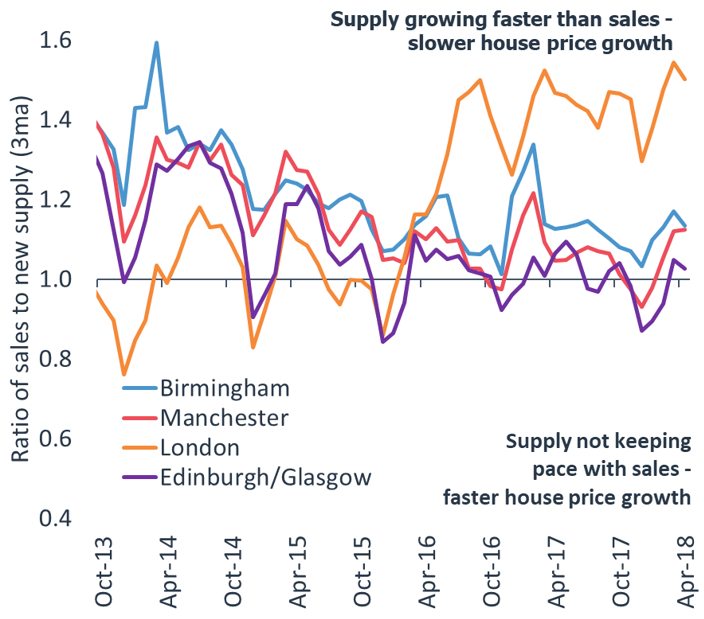
Trends in sales and new supply
Alongside sales, the supply of homes for sale has also been increasing. In cities where house price growth is above average we find that new supply is broadly in line with sales. Figure 2 shows that the ratio of sales to new supply is around 1 to 1.1x in Manchester, Birmingham, Edinburgh and Glasgow. This creates scarcity and, together with attractive affordability levels, supports above average capital growth.
Sales not keeping pace with supply in London
In London, sales are not keeping pace with new supply coming to the market. There are 1.5 homes coming to the market for every sale. The net result is longer sales periods – London has the longest time to sell of all the cities at 17 weeks – and weak house price inflation. Other cities where sales are not keeping pace with new supply include Oxford and Cambridge.
London prices up 1.6% in nominal terms
Price inflation in London remains positive at +1.6% with no sign of this shifting into negative territory in the near term. Capital values have registered a small increase (0.9%) over the last quarter suggesting some easing in the downward pressure on prices.
House price growth at a local authority level across London reveals a stabilisation in the rate of growth with prices changes over the last quarter remaining unchanged or improving modestly.
Coverage of price falls narrows in London
Last month we reported that residential values in London were falling across more than two fifths of postcodes and this has narrowed to 36% over March.
Price adjustment and greater realism by sellers
Signs of a slight improvement in market conditions in London are not surprising. Falls in asking prices over the last 2 years, especially in central areas of London, together with deeper discounts from asking to achieved prices and greater realism on the part of sellers appear to be supporting sales rates and reducing the downward pressure on prices.
Re-pricing takes time and is a drawn-out process
The re-pricing of housing in the face of weaker demand and rising supply takes time to work through into sales prices. The process is well established across London with house prices falling in real terms in 40 (87%) of the 46 local authorities in the London city index.
We expect house prices across London to continue to post modest falls in real terms over the next 12-24 months as prices re-align to what buyers are prepared to pay. It is early days, but there are some tentative signs that sales volumes could start to stabilise over 2018 as a result of more realistic pricing.
Kindly shared by Hometrack UK


