


UK Cities House Price Index – April 2018
Large regional UK cities are the strongest performers with signs of slower growth across the south coast. The pace of overall city level growth is losing momentum, partly due to static prices in London.
- UK city house price inflation 4.9% year on year compared to 6.9% per annum over the last 5 years.
- House price growth slowing and discounts to asking prices growing in cities across southern England.
- Large regional cities posting above average price growth with discounts from asking price narrowing.
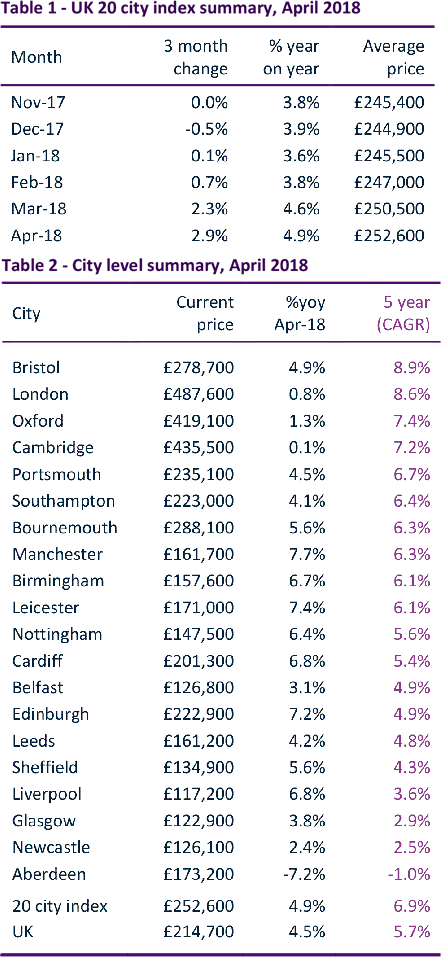
City house price growth running at 4.9%
UK city house prices have grown by 4.9% over the last year, higher than the 4.2% average over the last 2 years but lower than the 6.9% average over the last five. Manchester has the fastest growth rate (7.7%).
City house prices have increased 2.9% in the last three months compared to a 0.5% decline in 2017Q4 when price falls across London impacted headline growth.
Prices falling across 16 local authorities in London
The pace of price reductions in London has moderated over the last quarter. House prices are 0.8% higher than a year ago, although sixteen of the 46 local authorities that make up the London city index are registering negative growth of up to -2.8%.
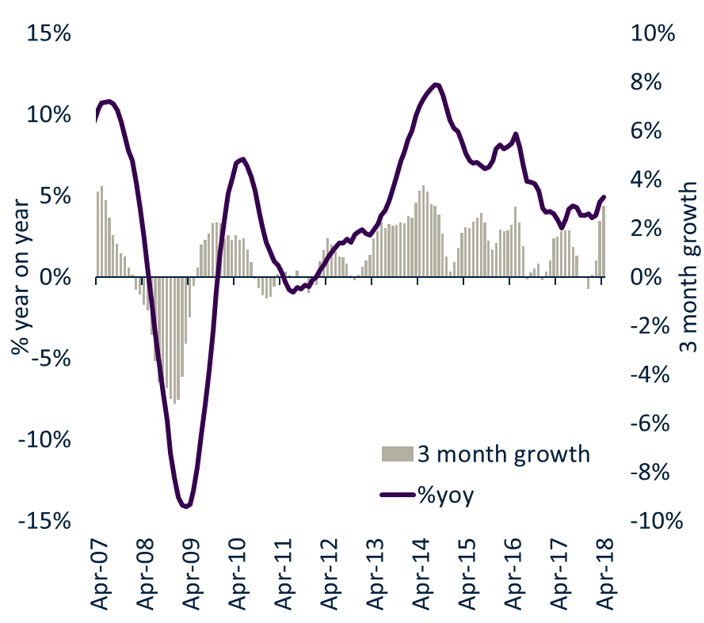
Figure 1
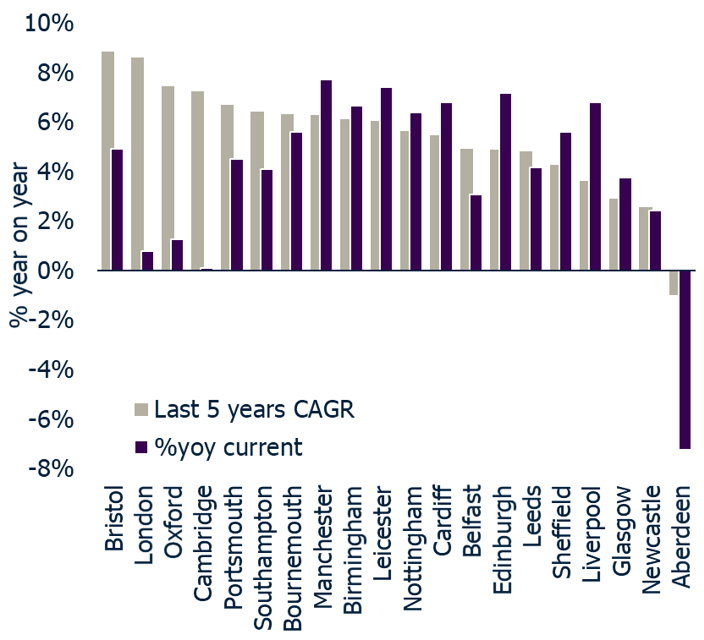
Figure 2
Bristol the top performer over 5 years, but slowing
The performance of city house prices over the last 1 and 5 years is shown in Fig. 2. It provides a snapshot for how the housing cycle is evolving. Bristol has registered the highest annual growth over the last 5 years (8.9% CAGR), but the growth rate is slowing with average prices up by 4.9% in the last year.
Signs of slower growth across the south coast
Cities across the south coast of England – Portsmouth, Southampton and, to a lesser degree Bournemouth, are also registering growth below the 5-year average as affordability pressures start to build.
Large regional cities the strongest performers
Large regional cities in the midlands, northern regions and Scotland continue to register annual growth above the 5-year average – Manchester, Birmingham, Leicester, Nottingham, Cardiff, Sheffield and Edinburgh. We believe that house prices have further to increase in these cities on attractive affordability levels and rising employment.
Discount from asking to sale prices varies
Other measures support this view. Figure 3 presents our latest analysis into the gap between asking and sales prices comparing 2018Q1 to the average over 2015-16. The discount from asking to sales prices continues to narrow in large regional cities suggesting further room for price rises. Birmingham and Manchester have the smallest discount (2.6%).
Not all regional cities are registering above average capital growth. The discount to asking price in Newcastle remains extended (5.5%) and house price growth is running at 2.4%. Discounts have narrowed in Liverpool but remain above average at 4.7% although price growth is above the 5-year average.
Aberdeen has largest discount to asking prices
The largest discounts (9.6%) are in Aberdeen where there has been a major demand side shock on the back of a lower oil price. House prices are falling by 7.2% per annum and have fallen by 19% since the end of 2014.
Discounts increasing in southern England
Market conditions are weakening in south eastern England but the size of discounts is less severe as prices are adjusting in weaker demand rather than as a result of adverse economic impacts. However, stretched affordability, Brexit uncertainty and multiple tax changes have impacted demand and mean sellers having to accept larger discounts to asking prices.
Discounts are starting to widen in cities such as Portsmouth and Southampton where the rate of house price growth is also slowing.
Housing cycle continues to unfold
The trends in relative house price growth and discounts from asking prices reveal how the housing cycle continues to unfold. The pace of overall city level growth is losing momentum, in part a result of virtually static prices in London.
Weaker consumer confidence and modest increase in mortgage rates are also impacting demand and mortgage approvals for home purchase has drifted lower in the last quarter.
Our cities index reveals how local and macro factors are impacting on house price growth where the strength of the local economy and the affordability of housing set an important benchmark.
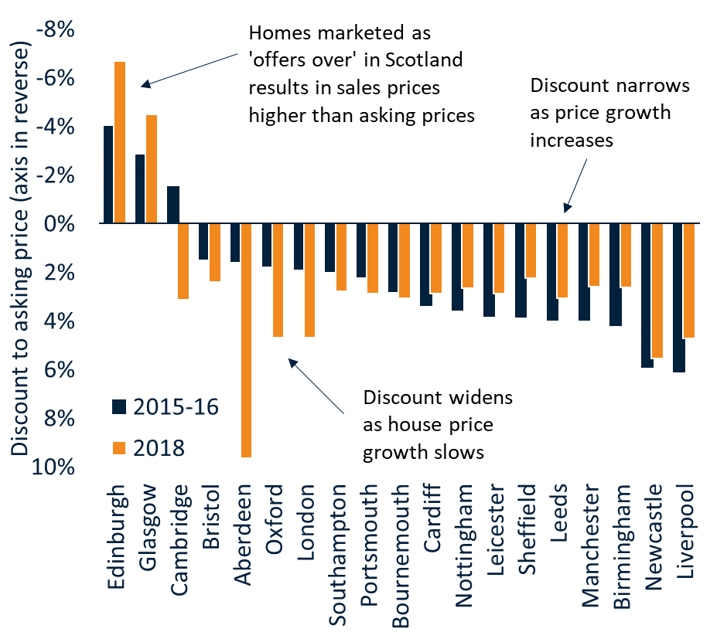
Figure 3
Kindly shared by Hometrack


