


Revealed: What the UK’s average house price will buy you across the UK
November 2021: This week ONS released the latest house price index, noting a rise in the average house price across the UK from £264,000 to £270,000.
A new study has revealed where UK homebuyers will get the most value for their money, based on the number of bedrooms, bathrooms, square meterage, chances of a driveway and the type of house across the top 30 most populated UK cities.
Key points from study:
- ONS released updated house price index on 17th November 2021
- New research reveals where homebuyers will get the most bang for their buck, based on the UK’s average house price
- Stoke-on-Trent named the best city for value for money, with the average property being detached and giving you 3 bathrooms, 4 bedrooms and a driveway
Stoke-on-Trent, Derby and Kingston upon Hull offer the most value for money, according to the analysis by conservatory supply and installation company, ConservatoryLand, while Southend-on-Sea, Reading and London offer very little for upwards of £270,000.
Whether looking for a property for a growing family or simply more space for guests, Stoke-on-Trent offers the best value, averaging 3 bedrooms, 3 bathrooms and a driveway. London is named the worst city in terms of value for money while outside of London it’s Reading, averaging 2 bedrooms and 2 bathrooms.
When it comes to square meterage, Cardiff offers the most space averaging £2,700 per square metre, while perhaps unsurprisingly London is named the most expensive with homebuyers paying an eye-watering £5,745 per square metre.
So, what exactly can the UK’s average house price, £270,000, get you across in the UK’s biggest cities?
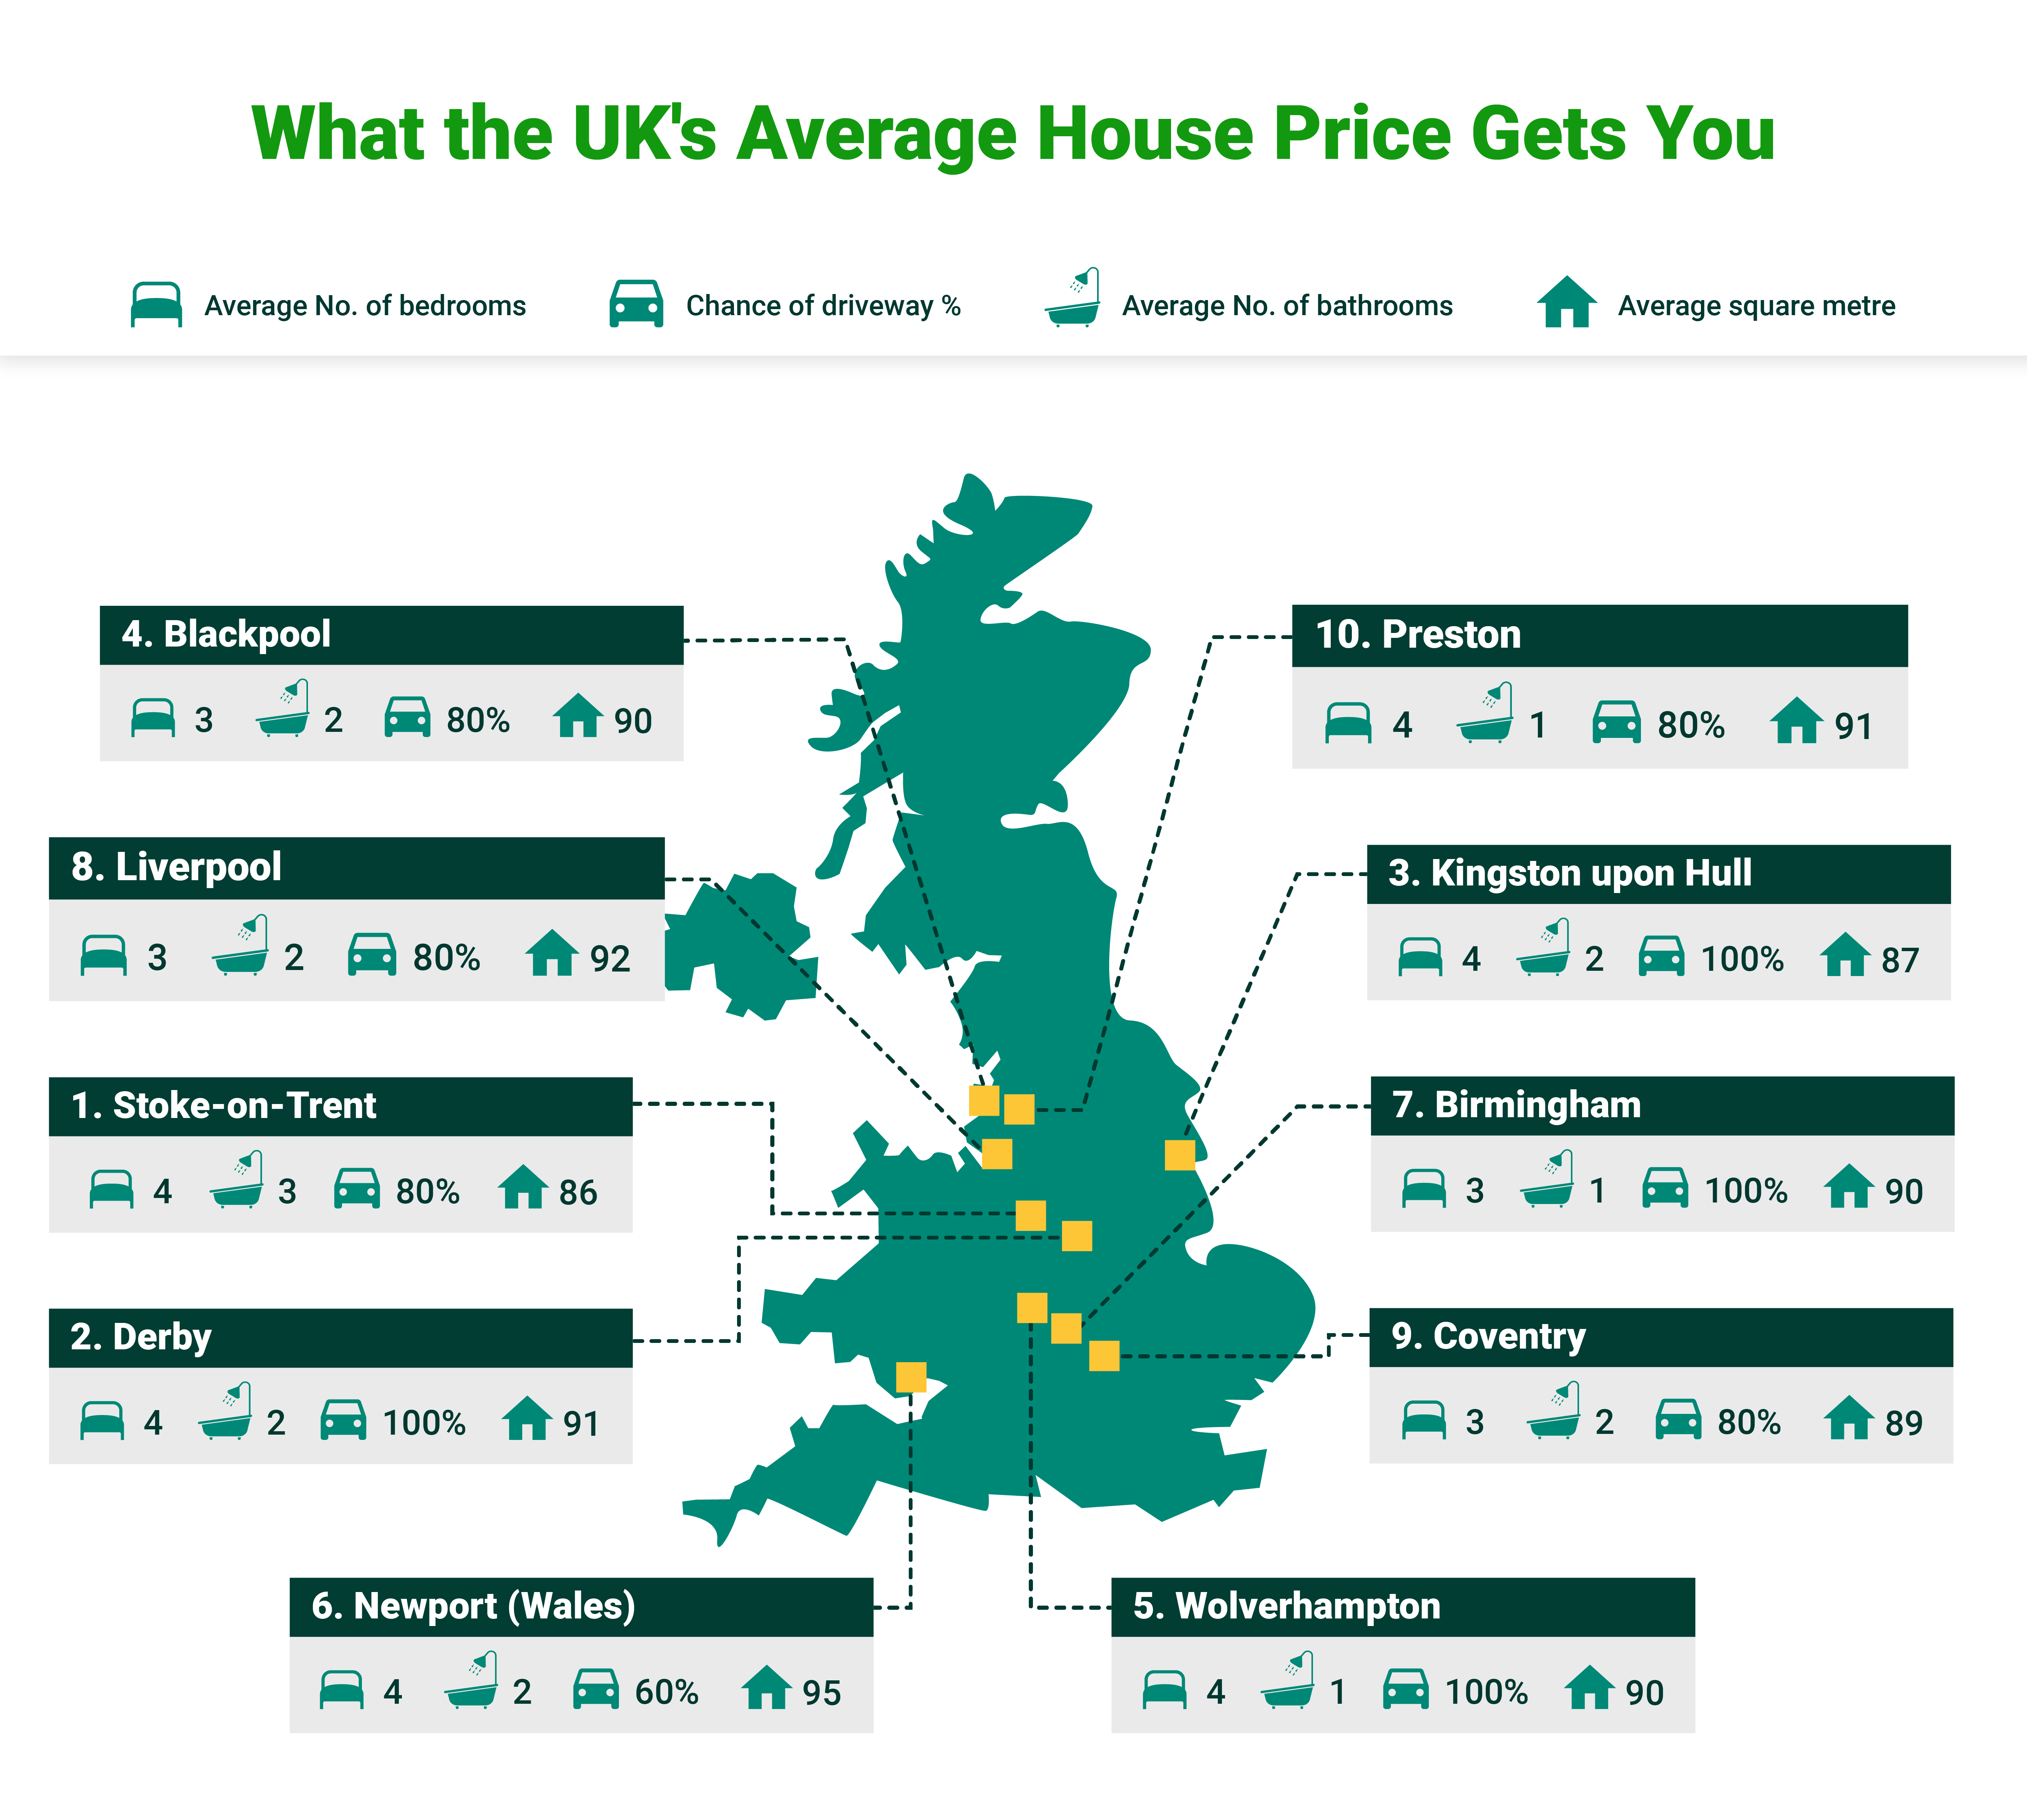
The top 10 cities for value for money:
| Rank | City | Average No. of bedrooms | Average No. of bathrooms | Chance of driveway (%) | Average square metre |
| 1 | Stoke-on-Trent | 4 | 3 | 80% | 86 |
| 2 | Derby | 4 | 2 | 100% | 91 |
| 3 | Kingston upon Hull | 4 | 2 | 100% | 87 |
| 4 | Blackpool | 3 | 2 | 80% | 90 |
| 5 | Wolverhampton | 4 | 1 | 100% | 90 |
| 6 | Newport (Wales) | 4 | 2 | 60% | 95 |
| 7 | Birmingham | 3 | 1 | 100% | 90 |
| 8 | Liverpool | 3 | 2 | 80% | 92 |
| 9 | Coventry | 3 | 2 | 80% | 89 |
| 10 | Preston | 4 | 1 | 80% | 91 |
The top 10 worst cities for value for money:
| Rank | City | Average No. of bedrooms | Average No. of bathrooms | Chance of driveway (%) | Average square metre |
| 1 | Norwich | 2 | 2 | 80% | 83 |
| 2 | Cardiff | 3 | 1 | 40% | 100 |
| 3 | Milton Keynes | 2 | 2 | 40% | 91 |
| 4 | Sheffield | 3 | 1 | 40% | 88 |
| 5 | Luton | 3 | 1 | 40% | 89 |
| 6 | Manchester | 2 | 1 | 40% | 86 |
| 7 | Bristol | 2 | 2 | 20% | 92 |
| 8 | Southend-on-Sea | 2 | 1 | 0% | 94 |
| 9 | Reading | 2 | 1 | 0% | 88 |
| 10 | London | 2 | 2 | 0% | 47 |
The full study can be found here.
Sources
https://www.ons.gov.uk/economy/inflationandpriceindices/bulletins/housepriceindex/september2021
https://worldpopulationreview.com/countries/cities/united-kingdom
https://www.zoopla.co.uk/house-prices/
Kindly shared by ConservatoryLand
Main photo courtesy of Pixabay


