










Lloyds House Price Index – June 2026

House prices edge up in June as Borrowing costs start to ease
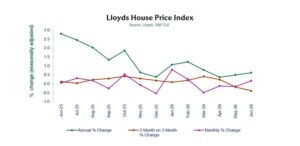
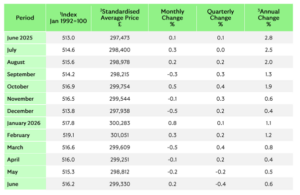
- House prices rose +0.2% in June, following a -0.2% fall in May
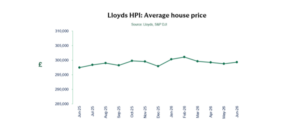
- Average property price now £299,330 compared with £298,812 in May
- Annual growth up slightly to +0.6%, from +0.5% in May
- Northern Ireland continues to record the UK’s strongest annual growth at +7.
Amanda Bryden, Head of Mortgages at Lloyds, said:
“House prices rose for the first time in four months during June, increasing by +0.2%, compared to May. The typical property now costs £299,330, while the annual rate of growth also edged higher to +0.6%.
“Recent price trends continue to reflect wider economic uncertainty, including the impact of global events on inflation and interest rate expectations. While affordability remains stretched for many buyers, mortgage rates have eased from their recent highs, offering some encouragement to those considering a move.
“While latest industry data shows the number of new mortgage approvals dropped in May, this wasn’t unexpected given the spike in rates seen earlier this year, and we’d expect to see activity recover assuming borrowing costs continue to fall.
“For first-time buyers, annual price growth increased to +0.8% in June from +0.3% in May, with the average first-time buyer property now costing £240,433, suggesting demand remains resilient.
“Looking ahead, we expect the housing market to continue moving at a measured pace. Lower borrowing costs should provide some support for demand, though affordability constraints remain an important factor. The outlook for house prices will depend largely on inflation continuing to ease and household confidence gradually improving.”
Nations and regions house prices
Northern Ireland continues to record the strongest annual house price growth in the UK . Average prices are up +7. 4% over the past year to £22 9,000 .
Scotland has the next highest annual growth, now at +3. 9%, with an average price of £ 223,277 .
In Wales , property price growth has strengthened again to +0. 9% on annual basis, taking the typical home value to £ 231,142.
In England, stronger price growth remains concentrated in northern regions. The North East saw prices rise +2.8 % over the year to £ 181,133, while the North West recorded annual growth of + 2.4 %, with the average property now costing £ 248,218 .
By contrast, southern markets continue to see prices fall. The South East led declines, with prices down -2.0 % year -on -year to £ 381,654 , while London saw average values fall by -1.1% to £ 534,831 .
Housing activity
- UK residential transactions fell by -2.0% to 98,450 in May 2026 (seasonally adjusted). On a non -seasonally adjusted basis, transactions rose by +7.0% over the month. In the three months to May, transactions were +1.2% higher than the preceding three months, while volumes were +16.6% above May 2025 levels (seasonally adjusted). (Source: HMRC)
- Bank of England data shows mortgage approvals for house purchase decreased by -14.9% to 56,205 in May 2026 ; approvals were also -10.8% lower than May 2025 levels (seasonally adjusted), suggesting activity has softened after recent gains. (Source: Bank of England, seasonally -adjusted figures)
- The latest RICS Residential Market Survey (May 2026) shows new buyer enquiries continue to follow a negative net balance at -34%, agreed sales an unchanged net balance at -37%, and new instructions a net balance of -8%. Overall, activity indicators remain subdued but appear to be stabilising after recent declines. (Source: Royal Institution of Chartered Surveyors (RICS) monthly report).
UK house prices : Historical data National: All houses, all buyers (seasonally adjusted)
Kindly shared by Lloyds