


House prices rise at fastest annual pace since 2007 to reach new record high – Halifax House Price Index
House prices rise at fastest annual pace since 2007 to reach new record high, according to the latest Halifax House Price Index, covering January.
Headlines:
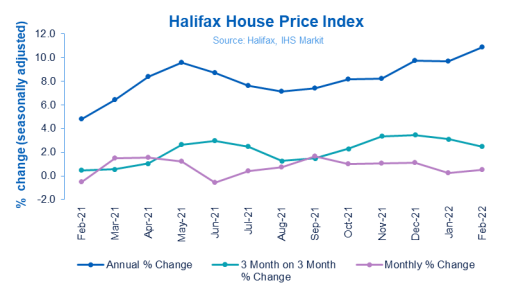
- Monthly house price growth rose to +0.5% following a slower start to the year
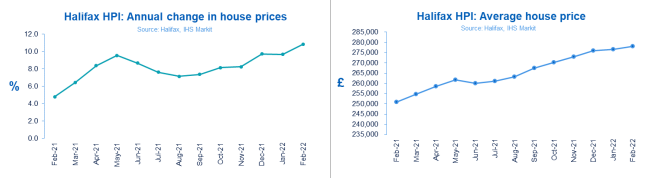
- Annual rate of growth at +10.8% is the strongest level since June 2007 (+11.9%)
- Average house price reaches another new record high of £278,123
- Squeeze on household finances still expected to weigh on the market this yea
| Average house price
£278,123 |
Monthly change
+0.5% |
Quarterly change +2.5% |
Annual change
+10.8% |
Russell Galley, Managing Director, Halifax, said:
“The UK housing market shrugged off a slightly slower start to the year with average property prices rising by another 0.5% in February, or £1,478 in cash terms. This was an eighth successive month of house price growth, as the resilience which has typified the market throughout the pandemic shows little sign of easing. Year-on-year prices grew by 10.8%, the fastest pace of annual growth since June 2007, pushing the average house price up to another record high of £278,123.
“Two years on from the start of the pandemic, average property values have now risen by £38,709 (+16%) since February 2020. Over the last 12 months alone house prices have gained on average £27,215. This is the biggest one-year cash rise recorded in over 39 years of index history.
“Lack of supply continues to underpin rising house prices, with recent industry surveys showing a dearth of new properties being listed, now a long-term trend. This may be a particular issue at the larger end of the property market. Over the past year the average price of detached properties (£43,251, +11%) have risen at a rate more than four times that of flats (£10,462, +7%) in cash terms.
“Looking ahead, as Covid moves into an endemic phase and almost all domestic restrictions are removed, geopolitical events expose the UK to new sources of uncertainty. The war in Ukraine is a human tragedy, but is also likely to have effects on confidence, trade and global supply chains.
“Surging oil and gas prices are one immediate consequence, meaning that inflation in the UK – already at a 30-year peak – will remain higher for longer. This will add to the squeeze on already stretched household incomes. While increases in Bank Rate look likely in the near term, the extent of the rises will depend on how it affects prices and companies’ approaches to pay over the months to come.
“These factors are likely to weigh on buyer demand as the year progresses, with market activity likely to return to more normal levels and an easing of house price growth to be expected.”
Regions’ and nations’ house prices:
Seven UK areas are now seeing double-digit annual house price inflation, highlighting not only the strength but the breadth of gains across the country.
Wales was once again the strongest performing nation or region, with annual house price growth of 13.8%, largely unchanged since January, with the average property price rising to £207,184.
The South West of England also continues to record big gains. Annual house price inflation is now up to 13.4%, with by far the strongest quarterly growth (3.5%) of any region (average house price of £293,968).
While there will be a variety of local factors influencing the strength of these respective housing markets, it’s notable that both areas benefit from greater availability of more rural, scenic living which has proven to be so popular amongst buyers throughout the pandemic.
Elsewhere Northern Ireland also continues to record strong price growth, with prices up 13.1% on this time last year, giving an average property value in February of £173,911.
House price growth remains robust in Scotland too. That said, despite the annual rate of house price growth picking up to 9.2%, remarkably Scotland now has the ‘weakest’ rate of annual growth of any area outside of London, again testament to the strength of house prices right across the UK. The average property price edged up to £193,777 in February.
As indicated above, London remains the weakest performing area of the UK, though the capital continued its recent upward trend with annual house price inflation now standing at 5.4%, its strongest level since the end of 2020.
Housing activity:
- HMRC monthly property transactions data shows UK home sales increased in January 2022. UK seasonally adjusted (SA) residential transactions in January 2022 were 106,990 – up by 5.1% from December’s figure of 101,840 (down 22.2% on a non-SA basis). Quarterly SA transactions (November-January 2022) were approximately 9.9% lower than the preceding three months (August 2021-October 2021). Year-on-year SA transactions were 10.6% lower than January 2021 (12.6% lower on a non-SA basis). (Source: HMRC)
- Latest Bank of England figures show the number of mortgages approved to finance house purchases rose in January 2022, by 4% to 73,992. Year-on-year the January figure was 23% below January 2021. (Source: Bank of England, seasonally-adjusted figures)
- In the latest RICS Residential Market Survey, a net balance of +16% respondents cited an increase in new buyer demand during January – a fifth consecutive month in positive territory (previously +9%). New instructions however remain in negative territory for a tenth consecutive month at -8% (-13% previously). Agreed sales also remain in negative territory, with the latest net balance standing at -4% (compared to -12% previously). (Source: Royal Institution of Chartered Surveyors’ (RICS) monthly report)
UK house prices Historical data National: All Houses, All Buyers (Seasonally Adjusted):
| Period | Index
Jan 1992=100 |
Standardised Average Price £ | Monthly Change % | Quarterly Change % | Annual Change % |
| February 2021 | 432.7 | 250,908 | -0.5 | 0.5 | 4.8 |
| March | 439.0 | 254,604 | 1.5 | 0.5 | 6.5 |
| April | 445.7 | 258,472 | 1.5 | 1.1 | 8.4 |
| May | 451.2 | 261,642 | 1.2 | 2.7 | 9.6 |
| June | 448.5 | 260,099 | -0.6 | 3.0 | 8.7 |
| July | 450.4 | 261,165 | 0.4 | 2.5 | 7.6 |
| August | 453.8 | 263,162 | 0.8 | 1.3 | 7.2 |
| September | 461.3 | 267,516 | 1.7 | 1.5 | 7.4 |
| October | 465.9 | 270,184 | 1.0 | 2.3 | 8.2 |
| November | 470.8 | 273,028 | 1.1 | 3.4 | 8.2 |
| December | 475.9 | 275,996 | 1.1 | 3.5 | 9.7 |
| January 2022 | 477.0 | 276,645 | 0.2 | 3.1 | 9.7 |
| February | 479.6 | 278,123 | 0.5 | 2.5 | 10.8 |
Kindly shared by Halifax
Main article photo courtesy of Pixabay


