


House prices continue to increase as market shows resilience – Halifax House Price Index
House prices continue to increase as market shows resilience, according to the latest Halifax House Price Index, covering June.
Key points from Index:
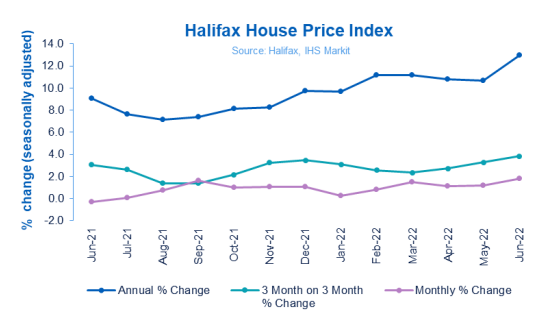
- House prices increased by 1.8% in June, the twelfth consecutive monthly rise
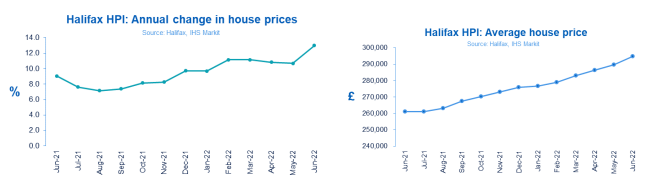
- Annual growth rate of 13% is the highest since late 2004
- Typical property now costs £294,845
- Northern Ireland continues to post the strongest growth in the UK
Russell Galley, Managing Director, Halifax, said:
“The UK housing market defied any expectations of a slowdown, with average property prices up 1.8% in June, the biggest monthly rise since early 2007. This means house prices have now risen every month over the last year, and are up by 6.8% or £18,849 in cash terms so far in 2022, pushing the typical UK house price to another record high of £294,845.
“The supply-demand imbalance continues to be the reason house prices are rising so sharply. Demand is still strong – though activity levels have slowed to be in line with pre-Covid averages – while the stock of available properties for sale remains extremely low.
“Property prices so far appear to have been largely insulated from the cost of living squeeze. This is partly because, right now, the rise in the cost of living is being felt most by people on lower incomes, who are typically less active in buying and selling houses. In contrast, higher earners are likely to be able to use extra funds saved during the pandemic, with latest industry data showing that mortgage lending has increased by the highest amount since last September.
“Of course, the housing market will not remain immune from the challenging economic environment. But for now it continues to demonstrate – as it has done over the last couple of years – the unique combination of factors impacting prices. One of these remains the huge shift in demand towards bigger properties, with average prices for detached houses rising by almost twice the rate of flats over the past year (+13.9% vs +7.6%).
“In time though increased pressure on household budgets from inflation and higher interest rates should weigh more heavily on the housing market, given the impact this has on affordability. Our latest research found that the strong rise in property prices over the last two years, coupled with much slower wage growth, has already pushed the house price to income ratio up to a record level.
“So while it may come later than previously anticipated, a slowing of house price growth should still be expected in the months ahead.”
Regions and nations house prices:
Northern Ireland once again topped the table for annual house price inflation, up by 15.2%, equating to an average property price of £187,833.
Wales also continues to record a strong rate of annual growth, up by 14.3%, with an average property cost of £219,281.
Meanwhile the South West saw the highest annual house price growth of any region in England, at 14.2%, where a typical home now costs £308,128.
Scotland too saw an increase in the rate of annual house price inflation, up to 9.9%. A Scottish home now costs an average of £201,549, breaking through £200,000 for the first time in history.
London continues to lag behind other regions in terms of annual house price inflation (+7.1%), though with an average property price of £547,031 it remains by far the most expensive place in the UK to buy a home.
Housing activity:
- HMRC monthly property transactions data shows UK home sales increased in May 2022. UK seasonally adjusted (SA) residential transactions in May 2022 were 109,210 – up by 1.3% from April’s figure of 107,780 (up 1.6% on a non-SA basis). Quarterly SA transactions (March-May 2022) were approximately 4.2% higher than the preceding three months (December 2021-February 2022). Year-on-year SA transactions were 5.1% lower than May 2021 (2.0% lower on a non-SA basis). (Source: HMRC)
- Latest Bank of England figures show the number of mortgages approved to finance house purchases rose in May 2022, by 0.1% to 66,163. Year-on-year the May figure was 23.4% below May 2021. (Source: Bank of England, seasonally-adjusted figures)
- The latest RICS Residential Market Survey shows a modest decline in buyer demand during May. The net balance score for new buying enquiries of -7%, down from +8% previously, brings an end to eight consecutive positive monthly readings. Agreed sales have a net balance of -2% (-3% previously) and new instructions returned a net balance score of zero (previously -2%). (Source: Royal Institution of Chartered Surveyors’ (RICS) monthly report)
UK house prices – Historical data:
National: All Houses, All Buyers (Seasonally Adjusted)
| Period | Index
Jan 1992=100 |
Standardised average price
£ |
Monthly change
% |
Quarterly change
% |
Annual change
% |
| June 2021 | 450.0 | 260,973 | -0.3 | 3.1 | 9.1 |
| July | 450.4 | 261,165 | 0.1 | 2.6 | 7.6 |
| August | 453.8 | 263,162 | 0.8 | 1.4 | 7.2 |
| September | 461.3 | 267,516 | 1.7 | 1.4 | 7.4 |
| October | 465.9 | 270,184 | 1.0 | 2.2 | 8.2 |
| November | 470.8 | 273,028 | 1.1 | 3.2 | 8.2 |
| December | 475.9 | 275,996 | 1.1 | 3.5 | 9.7 |
| January 2022 | 477.0 | 276,645 | 0.2 | 3.1 | 9.7 |
| February | 480.9 | 278,894 | 0.8 | 2.6 | 11.2 |
| March | 488.0 | 283,001 | 1.5 | 2.4 | 11.1 |
| April | 493.6 | 286,242 | 1.2 | 2.7 | 10.8 |
| May | 499.5 | 289,666 | 1.2 | 3.3 | 10.7 |
| June | 508.4 | 294,845 | 1.8 | 3.8 | 13.0 |
Kindly shared by Halifax
Main article photo courtesy of Pixabay


