


House price growth slowed in January, but average price still hits new record high – Halifax House Price Index
House price growth slowed in January, but average price still hits new record high, according to the latest Halifax House Price Index, covering January.
Headlines:
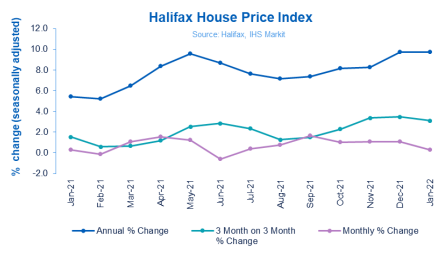
- Monthly house price growth fell to +0.3%, lowest rise since June 2021
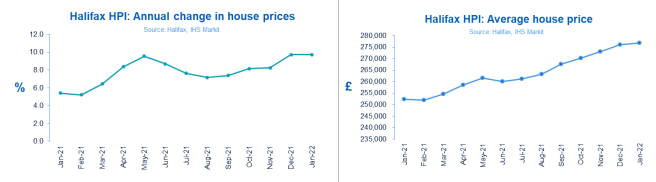
- Annual rate of growth remains steady at 9.7%
- Average house price edges up to new record high of £276,759
- Transaction volumes return towards pre-Covid levels
|
Average house price £276,759 |
Monthly change
+0.3% |
Quarterly change
+3.1% |
Annual change
+9.7% |
Russell Galley, Managing Director, Halifax, said:
“House price growth slowed somewhat at the start of the year, rising by just 0.3% in January, the smallest monthly increase since June 2021. This followed four consecutive months of gains above 1%, and with annual growth remaining at 9.7%, the average UK house price was little changed, edging up slightly to a new record high of £276,759. Overall prices remain around £24,500 up on this time last year, and £37,500 higher than two years ago.
“Following the peak activity of 2021, transaction volumes are returning to more normal levels. Affordability remains at historically low levels as house price rises continue to outstrip earnings growth. Despite record levels of first-time buyers stepping onto the ladder last year, younger generations still face significant barriers to home ownership as deposit requirements remain challenging.
“This situation is expected to become more acute in the short-term as household budgets face even greater pressure from an increase in the cost of living, and rises in interest rates begin to feed through to mortgage rates. While the limited supply of new housing stock to the market will continue to provide some support to house prices, it remains likely that the rate of house price growth will slow considerably over the next year.”
Regions and nations house prices
In keeping with last year, Wales kicked off 2022 as by far the strongest performing nation or region in the UK. With annual house price inflation of 13.9%, down marginally from December, the average house price fell slightly to £205,253.
Northern Ireland also continues to record strong price growth, with prices up 10.2% on last year, giving an average property value in January of £170,982.
House price growth remains strong in Scotland too, though the annual rate of inflation slowed somewhat to 8.9%, with the average property price edging down to £192,698.
In England, the North West was once again the strongest performing region (up 12.0% year-on-year, average house price of £213,200) and now has the second highest rate of annual growth in the UK.
While London remains the weakest performing area of the UK, the capital continued its recent upward trend with annual house price inflation accelerating for a third straight month to now stand at 4.5%. This was double the rate recorded in December and its strongest performance in over a year.
Housing activity:
- HMRC monthly property transactions data shows UK home sales increased in December 2021. UK seasonally adjusted residential transactions in December 2021 were 100,110 – up by 7.6% from November’s figure of 93,050 (up 11.8% on a non-seasonally adjusted basis). Quarterly transactions (October-December 2021) were approximately 18.5% (seasonally adjusted) lower than the preceding three months (July 2021-September 2021). Year-on-year, transactions were 20.0% (seasonally adjusted)lower than December 2020 (14.6% lower on a non-seasonally adjusted basis). (Source: HMRC)
- Latest Bank of England figures show the number of mortgages approved to finance house purchases rose in December 2021, by 5% to 71,015. Year-on-year the December figure was 30% below December 2020. (Source: Bank of England, seasonally-adjusted figures)
- In the latest RICS Residential Market Survey, a net balance of +9% respondents cited an increase in new buyer demand during December – a fourth consecutive month in positive territory (previously +12%). New instructions however remain in negative territory for a ninth consecutive month at -14% (-16% previously). Agreed sales also remain in negative territory, with the latest net balance standing at -13% (compared to -9% previously). (Source: Royal Institution of Chartered Surveyors’ (RICS) monthly report)
UK house prices Historical data National: All Houses, All Buyers (Seasonally-Adjusted):
| Period | Index
Jan 1992=100 |
Standardised Average Price £ | Monthly Change % | Quarterly Change % | Annual Change % |
| January 2021 | 434.9 | 252,229 | 0.3 | 1.5 | 5.4 |
| February | 434.3 | 251,856 | -0.2 | 0.6 | 5.2 |
| March | 439.0 | 254,604 | 1.1 | 0.7 | 6.5 |
| April | 445.7 | 258,472 | 1.5 | 1.2 | 8.4 |
| May | 451.2 | 261,642 | 1.2 | 2.5 | 9.6 |
| June | 448.5 | 260,099 | -0.6 | 2.8 | 8.7 |
| July | 450.4 | 261,165 | 0.4 | 2.3 | 7.6 |
| August | 453.8 | 263,162 | 0.8 | 1.3 | 7.2 |
| September | 461.3 | 267,516 | 1.7 | 1.5 | 7.4 |
| October | 465.9 | 270,184 | 1.0 | 2.3 | 8.2 |
| November | 470.8 | 273,028 | 1.1 | 3.4 | 8.2 |
| December | 475.9 | 275,996 | 1.1 | 3.5 | 9.7 |
| January 2022 | 477.2 | 276,759 | 0.3 | 3.1 | 9.7 |
Kindly shared by Halifax
Main article photo courtesy of Pixabay


