


Halifax HPI: UK house prices rise for the second month in a row
The Halifax HPI for November 2023 has been published, showing UK house prices rise for the second month in a row.
Key points from publication:
-
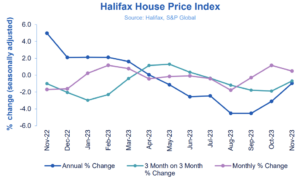
- Average house prices rose by +0.5% in November, following a rise of +1.2% in October
- Property prices dropped by -1.0% on an annual basis (vs -3.1% last month)
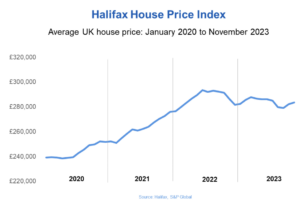
- Typical UK home now costs £283,615, around £1,300 more than last month
- South East England continues to see most downward pressure on house prices
Key indicators:
|
Average house price |
Monthly change |
Quarterly change |
Annual change |
|
£283,615 |
+0.5% |
-0.7% |
-1.0% |
Kim Kinnaird, Director, Halifax Mortgages, said:
“UK house prices rose for the second month in a row, up by +0.5% in November or £1,394 in cash terms, with the average house price now sitting at £283,615.
“Over the last year, despite the wider economic headwinds, property prices have held up better than expected, falling by a relatively modest -1.0% on an annual basis, and still some £40,000 above pre-pandemic levels.
“The resilience seen in house prices during 2023 continues to be underpinned by a shortage of properties available, rather than any significant strengthening of buyer demand.
“That said, recent figures for mortgage approvals suggest a slight uptick in activity levels, which is likely as a result of an improving picture on affordability for homebuyers.
“With mortgage rates starting to ease slightly, this may be leading to increased buyer confidence, seeing people more inclined to push ahead with their home purchases.
“However, the economic conditions remain uncertain, making it hard to assess the extent to which market activity will be maintained.
“Other pressures – like inflation, the broader cost of living, overall employment rates and affordability – mean we expect to see downward pressure on house prices into next year.”
Nations and regions house prices:
Northern Ireland is the strongest performing nation or region in the UK, with house prices increasing by +2.3% on an annual basis. Properties in Northern Ireland now cost on average £189,684, which is £4,294 higher than the same time last year.
House prices in Scotland also continue to show resilience, though growth has flattened over the last year (0.0%), with the average property in the country now costing £203,116.
Wales recorded one of the lowest annual falls (-1.5%), with homes selling for an average of £215,787 in November.
At the other end of the scale, property prices in the South East fell most sharply when compared to other UK regions over the last year (-5.7%) to £373,943, a drop of -£22,702.
London retains the top spot for the highest average house price in the UK, at £524,592, though prices in the capital have now fallen by -3.8% on an annual basis.
Housing activity:
-
- HMRC monthly property transaction data shows UK home sales decreased in October 2023. UK seasonally adjusted (SA) residential transactions in October 2023 totalled 82,910 – down by 2.5% from September’s figure of 85,060 (down 2.0% on a non-SA basis). Quarterly SA transactions (August 2023 – October 2023) were approximately 0,6% higher than the preceding three months (May 2023 – July 2023). Year-on-year SA transactions were 20.5% lower than October 2022 (17.3% lower on a non-SA basis). (Source: HMRC)
- Latest Bank of England figures show the number of mortgages approved to finance house purchases increased in October 2023, by 8.5% to 47,383. Year-on-year the October figure was 17.1% below October 2022. (Source: Bank of England, seasonally-adjusted figures)
- The RICS Residential Market Survey results for October 2023 show a subdued market although slightly less downbeat over the month. New buyer enquiries returned a net balance of -28%, up from -37% in September, agreed sales -25% (up from -35%) and new instructions -7% (up from -15%). (Source: Royal Institution of Chartered Surveyors (RICS) monthly report)
UK house prices Historical data National: All Houses, All Buyers (Seasonally Adjusted):
|
Period |
Index Jan 1992=100 |
Standardised average price £ |
Monthly change % |
Quarterly change % |
Annual change % |
|
November 2022 |
493.7 |
286,328 |
-1.7 |
-1.0 |
5.0 |
|
December |
485.8 |
281,713 |
-1.6 |
-2.0 |
2.1 |
|
January 2023 |
486.9 |
282,360 |
0.2 |
-3.0 |
2.1 |
|
February |
492.6 |
285,660 |
1.2 |
-2.3 |
2.1 |
|
March |
496.4 |
287,891 |
0.8 |
-0.4 |
1.6 |
|
April |
494.3 |
286,662 |
-0.4 |
1.2 |
0.1 |
|
May |
493.6 |
286,234 |
-0.2 |
1.3 |
-1.1 |
|
June |
493.2 |
286,011 |
-0.1 |
0.4 |
-2.6 |
|
July |
491.2 |
284,852 |
-0.4 |
-0.4 |
-2.5 |
|
August |
482.5 |
279,793 |
-1.8 |
-1.2 |
-4.5 |
|
September |
481.1 |
278,985 |
-0.3 |
-1.8 |
-4.5 |
|
October |
486.7 |
282,221 |
1.2 |
-1.9 |
-3.1 |
|
November |
489.1 |
283,615 |
0.5 |
-0.7 |
-1.0 |
Next publication:
The next Halifax House Price Index for October 2023 will be published at 07:00 on Friday, 5 January 2024.
Kindly shared by Halifax


