


Halifax HPI: Positive start to 2024 for UK house prices
The Halifax HPI for January 2024 has been published, showing a positive start to the year for UK house prices.
Key points from publication:
-
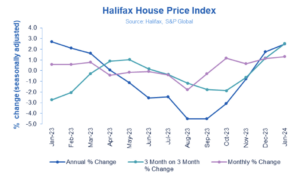
- Average house prices rose by +1.3% in January, the fourth monthly rise in a row
- Property prices grew +2.5% annually, the highest annual growth since January 2023
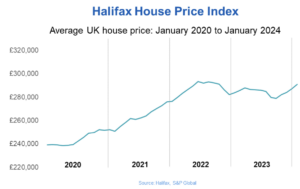
- Typical UK home now costs £291,029, over £3,900 more than last month
- South-East England continues to see most downward pressure on house prices
Key indicators:
|
Average house price |
Monthly change |
Quarterly change |
Annual change |
|
£291,029 |
+1.3% |
+2.5% |
+2.5% |
Kim Kinnaird, Director, Halifax Mortgages, said:
“The average house price in January was £291,029, up +1.3% or, in cash terms, £3,924 compared to December 2023.
“This is the fourth consecutive month that house prices have risen, and, as a result, the pace of annual growth is now +2.5%, the highest rate since January last year.
“The recent reduction of mortgage rates from lenders as competition picks up, alongside fading inflationary pressures and a still-resilient labour market has contributed to increased confidence among buyers and sellers.
“This has resulted in a positive start to 2024’s housing market.
“However, while housing activity has increased over recent months, interest rates remain elevated compared to the historic lows seen in recent years and demand continues to exceed supply.
“For those looking to buy a first home, the average deposit raised is now £53,414, around 19% of the purchase price.
“It’s not surprising that almost two thirds (63%) of new buyers getting a foot on the ladder are now buying in joint names.
“Looking ahead, affordability challenges are likely to remain and further modest falls should not be ruled out, against a backdrop of broader uncertainty in the economic environment.”
Nations and regions house prices:
Northern Ireland recorded the strongest growth across all the nations or regions within the UK – house prices here increased by +5.3% on an annual basis. Properties in Northern Ireland now cost on average £195,760, which is £9,761 higher than the same time in January 2023.
Scotland and Wales both saw positive growth, +4% on an annual basis to £206,087 and £219,609 respectively. North-West (+3.2%), Yorkshire and Humber (+2.8%), North East (+2.0%) and East Midlands (0.5%) also recorded house price increases over the last year.
The South-East fell the most last month when compared to other UK regions, with homes selling for an average £379,220 (-2.3%), a drop of £8,866.
London retains the top spot for the highest average house price across all the regions, at £529,528, albeit prices in the capital have declined by -0.4% on an annual basis.
Housing activity:
-
- HMRC monthly property transaction data shows UK home sales decreased in December 2023. UK seasonally adjusted (SA) residential transactions in December 2023 totalled 80,420 – down by 0.8% from November’s figure of 81,070 (down 2.1% on a non-SA basis). Quarterly SA transactions (October 2023 – December 2023) were approximately 4.8% lower than the preceding three months (July 2023 – September 2023). Year-on-year SA transactions were 17.8% lower than December 2022 (20.2% lower on a non-SA basis). (Source: HMRC)
- Latest Bank of England figures show the number of mortgages approved to finance house purchases increased in December 2023, by 2.3% to 50,459. Year-on-year the December figure was 25.6% above December 2022. (Source: Bank of England, seasonally-adjusted figures)
- The RICS Residential Market Survey results for December 2023 show another gradual improvement. New buyer enquiries balance improved to -3%, from -13% in November, with agreed sales improving to -6% (from – 10%). New instructions move back into positive territory for the first time since May 2023 with a net balance of +1% (from -4%). (Source: Royal Institution of Chartered Surveyors (RICS) monthly report)
UK house prices Historical data National: All Houses, All Buyers (Seasonally Adjusted):
|
Period |
Index Jan 1992=100 |
Standardised average price (£) |
Monthly change (%) |
Quarterly change (%) |
Annual change (%) |
|
January 2023 |
489.7 |
283,976 |
0.6 |
-2.7 |
2.7 |
|
February |
492.6 |
285,660 |
0.6 |
-2.1 |
2.1 |
|
March |
496.4 |
287,891 |
0.8 |
-0.3 |
1.6 |
|
April |
494.3 |
286,662 |
-0.4 |
0.9 |
0.1 |
|
May |
493.6 |
286,234 |
-0.2 |
1.0 |
-1.1 |
|
June |
493.2 |
286,011 |
-0.1 |
0.2 |
-2.6 |
|
July |
491.2 |
284,852 |
-0.4 |
-0.4 |
-2.5 |
|
August |
482.5 |
279,793 |
-1.8 |
-1.2 |
-4.5 |
|
September |
481.1 |
278,985 |
-0.3 |
-1.8 |
-4.5 |
|
October |
486.7 |
282,221 |
1.2 |
-1.9 |
-3.1 |
|
November |
489.8 |
284,039 |
0.6 |
-0.6 |
-0.8 |
|
December |
495.3 |
287,244 |
1.1 |
1.2 |
1.8 |
|
January 2024 |
501.9 |
291,029 |
1.3 |
2.5 |
2.5 |
Next publication:
The next Halifax House Price Index for February 2024 will be published at 07:00 on Thursday, 7 March 2024.
Kindly shared by Halifax


