


Halifax HPI: House prices in February 2024 were 1.7% higher than the same month a year earlier
The Halifax HPI for February 2024 has been published, showing house prices in February 2024 were 1.7% higher than the same month a year earlier.
Key points from publication:
-
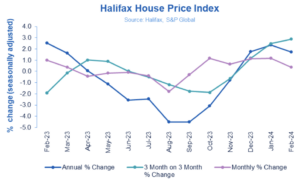
- Average house prices rose by +0.4% in February, the fifth monthly rise in a row
- Property prices grew +1.7% on an annual basis (vs +2.3% last month)
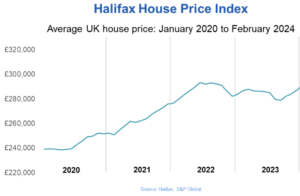
- Typical UK home now costs £291,699, around £1,000 more than last month
- Eastern England saw most downward pressure on house prices
Key indicators:
|
Average house price |
Monthly change |
Quarterly change |
Annual change |
|
£291,699 |
+0.4% |
+2.9% |
+1.7% |
Kim Kinnaird, Director, Halifax Mortgages, said:
“UK house prices rose for the fifth consecutive month in February, up by +0.4% or £1,091 in cash terms, with the average house price now £291,699.
“On an annual basis, house prices were +1.7% higher than a year ago, slowing from +2.3% in January.
“However, these figures continue to suggest a relatively stable start to 2024 and align with other promising signs of increased housing activity, such as mortgage approvals.
“In fact, the average price tag of a home is now only around £1,800 off the peak seen in June 2022.
“While it is encouraging that we’ve seen growth in recent months, what happens next remains uncertain.
“Although lower mortgage rates, alongside expectations of Bank of England interest rate cuts this year, should help buyer confidence in the short term, the downward trend on rates is showing signs of fading.
“Even with growing wages and inflation falling back, raising a deposit and affording a sizeable mortgage remains challenging, especially for those looking to join the property ladder, so it remains a possibility that there could be a slowdown in the housing market this year.”
Nations and regions house price:
Northern Ireland is the strongest performing nation or region in the UK – house prices here increased by +5% on an annual basis. Properties in Northern Ireland now cost an average £195,956, which is £9,359 more than the same time in February 2023.
The North West saw positive growth of +4.4% on an annual basis to £232,128. The North East (+4.2%) and Wales (+4.1%) also recorded strong increases over the last year.
London continues to have the highest average house price across all of the regions, at £536,996. Prices in the capital have increased +1.5% and is the first positive annual growth seen since January 2023.
Properties in Eastern England fell the most last month, when compared to the rest of the UK’s nations and regions, with homes selling for an average of £329,927 (-0.8%), a drop of £2,794 since the same time in 2023.
Housing activity:
-
- HMRC monthly property transaction data shows UK home sales increased in January 2024. UK seasonally adjusted (SA) residential transactions in January 2024 totalled 82,000 – up by 1.9% from Decembers figure of 80,500 (down 19.9% on a non-SA basis). Quarterly SA transactions (November 2023 – January 2024) were approximately 3.8% lower than the preceding three months (August 2023 – October 2023). Year-on-year SA transactions were 11.9% lower than January 2023 (10.0% lower on a non-SA basis). (Source: HMRC)
- Latest Bank of England figures show the number of mortgages approved to finance house purchases increased in January 2024, by 7.2% to 55,227. Year-on-year the January figure was 40.2% above January 2023. (Source: Bank of England, seasonally-adjusted figures)
- The RICS Residential Market Survey results for January 2024 show another slight improvement with sales market indicators out of negative territory. New buyer enquiries balance improved to +7%, from -3% in December, with agreed sales improving to +5% (from -5%). New instructions increase to a net balance of +11% (from +2%). (Source: Royal Institution of Chartered Surveyors (RICS) monthly report)
UK house prices – Historical data – National: All Houses, All Buyers (Seasonally Adjusted):
|
Period |
Index Jan 1992=100 |
Standardised average price £ |
Monthly change % |
Quarterly change % |
Annual change % |
|
February 2023 |
494.6 |
286,805 |
1.0 |
-1.9 |
2.5 |
|
March |
496.4 |
287,891 |
0.4 |
-0.1 |
1.6 |
|
April |
494.3 |
286,662 |
-0.4 |
1.0 |
0.1 |
|
May |
493.6 |
286,234 |
-0.2 |
1.9 |
-1.1 |
|
June |
493.2 |
286,011 |
-0.1 |
0.0 |
-2.6 |
|
July |
491.2 |
284,852 |
-0.4 |
-0.5 |
-2.5 |
|
August |
482.5 |
279,793 |
-1.8 |
-1.2 |
-4.5 |
|
September |
481.1 |
278,985 |
-0.3 |
-1.8 |
-4.5 |
|
October |
486.7 |
282,221 |
1.2 |
-1.9 |
-3.1 |
|
November |
489.8 |
284,039 |
0.6 |
-0.6 |
-0.8 |
|
December |
495.3 |
287,244 |
1.1 |
1.2 |
1.8 |
|
January 2024 |
501.1 |
290,608 |
1.2 |
2.5 |
2.3 |
|
February |
503.0 |
291,699 |
0.4 |
2.9 |
1.7 |
Next publication:
The next Halifax House Price Index for March 2024 will be published at 07:00 on Friday, 5 April 2024.
Kindly shared by Halifax


