


Halifax House Prices: Annual House Price Growth Stable at 1.3%
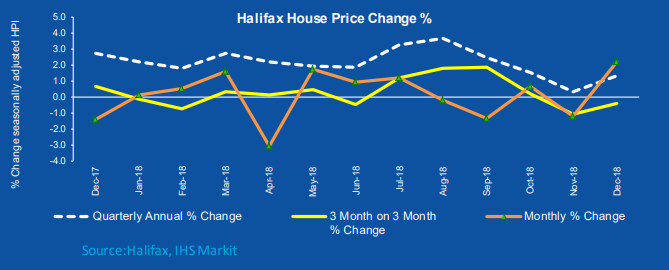
Prices in the three months to December were 1.3% higher than previous year, house prices were 0.4% lower than in preceding three months.
- Prices in the three months to December were 1.3% higher than in the same three months a year earlier – up from the 0.3% annual growth rate recorded in November
- House prices in the latest quarter (October-December) were 0.4% lower than in the preceding three months (July – September)
- On a monthly basis, house prices increased by 2.2% in December, following a 1.2% fall in November
- The average house price is now £229,729
| +1.3% Annual change | -0.4% Quarterly change | +2.2% Monthly change | £229,729 Average Price |
Russell Galley, Managing Director, Halifax, said:
“In December the average cost of a home was £229,729 and annual house price growth stood at 1.3%. A stronger monthly growth figure for December reversed a weak November figure, monthly fluctuations are common, leaving the annual figure very firmly in the range of 0-3% as we forecast at the start of the year. In 2019, we’re expecting continued stability in house prices with between 2% and 4% price inflation. This is slightly stronger than 2018, but still fairly subdued by modern comparison. However, this expectation will clearly be dependent on the Brexit outcome, with risks to both sides of our forecast. Of course, there are a number of other factors that will impact the market in 2019. The need to raise a significant deposit still acts as a restraint for those looking to buy a new home, limiting the number of potential purchasers. This year, mortgage payment affordability is more difficult to predict. There are competing pressures with signs of positive annual pay growth supporting affordability, but risks associated with the potential for higher interest rates are pulling in the other direction. On balance we do not see affordability pushing house price growth significantly in either direction. The shortage of homes for sale and continuing low levels of housebuilding both constrain the supply of houses, and in turn support high prices, which will continue to inhibit demand in 2019.”
Key Facts Housing Activity
- Monthly UK home sales maintain slight rise in latest quarter: The November home sales figure of 100,930 was 100 above the October sales figure. November sales were also 1.8% above the previous 12-month average. There has also been a 2.1% rise when compared to the previous quarter in 2018. However, on a longer view less change is evident as the November figure of 100,930 is marginally below the 5-year average of 101,587. (Source: HMRC, seasonally-adjusted figures)
- In November mortgage approvals fell to the lowest rate since April 2018: Bank of England industry-wide figures show that the number of mortgages approved to finance house purchases – a leading indicator of completed house sales fell 4.5% to 63,728. October had seen a relatively high approval rate for 2018, and while there is a drop in November, it is still not far below the 2018 average of 64,955. (Source: Bank of England, seasonally-adjusted figures)
- Demand for housing and the number of sales both fall: The November 2018 RICS UK Residential Market Survey showed a drop on nearly every measure reviewed. The New Buyer Enquiries gauge fell to -21% in the latest results from -15% previously, indicating property purchasers are more cautious. Further to this the Newly Agreed Sales net balance moved to -15% from -10% indicating a decline in national sales transactions. (Source: Royal Institution of Chartered Surveyors’ (RICS) monthly report)
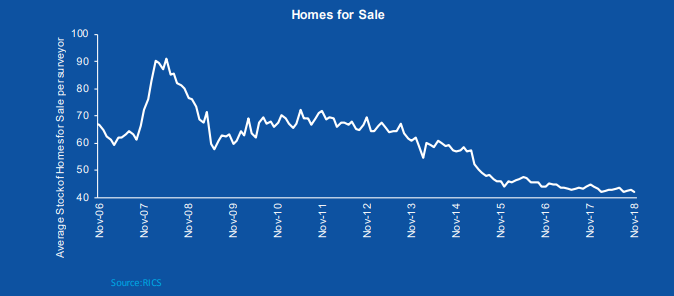
1. INDEX The standardised index is seasonally adjusted using the U.S. Bureau of the Census X-11 moving-average method based on a rolling 84- 40 50 60 70 80 90 100 Nov-06 Nov-07 Nov-08 Nov-09 Nov-10 Nov-11 Nov-12 Nov-13 Nov-14 Nov-15 Nov-16 Nov-17 Nov-18 Average Stock of Homes for Sale per surveyor Homes for Sale Source:RICS 424TC-PDT90-HX3EW-SVCM5-3P1JK month series. Each month, the seasonally adjusted figure for the same month a year ago and last month’s figure are subject to revision.
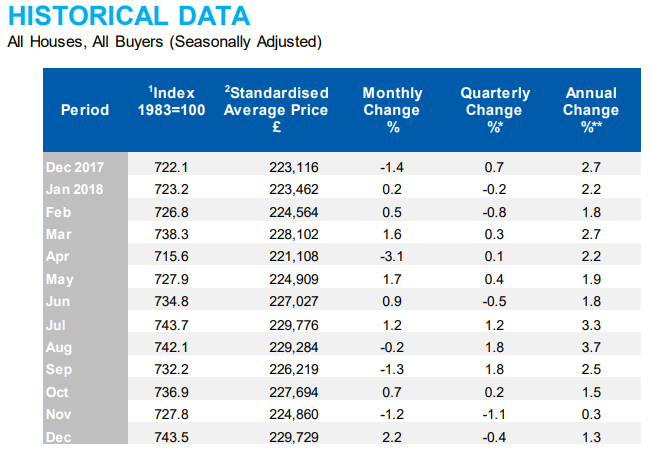
2. STANDARDISED AVERAGE PRICE The standardised average price is calculated using the HPI’s mix adjusted methodology.
Kindly shared by Halifax


