


Halifax House Price Index – September
House prices edge down in September
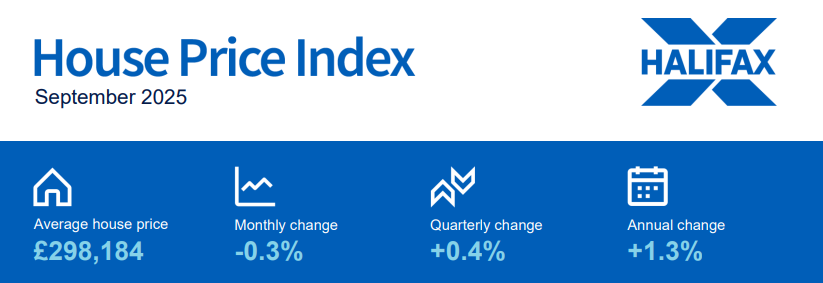
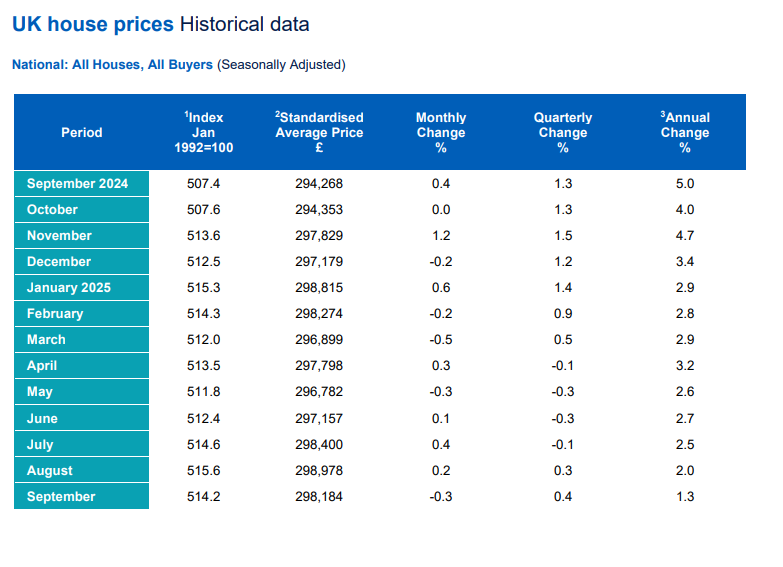
- House prices decreased by -0.3% in September vs a rise of +0.2% in August
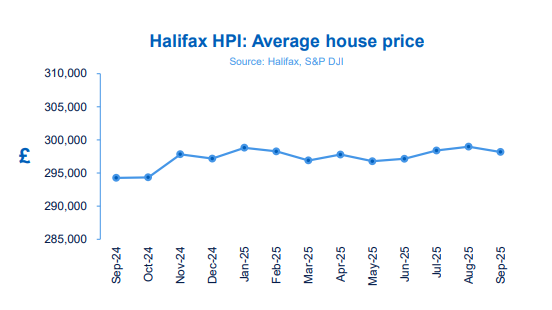
- Average property price now £298,184
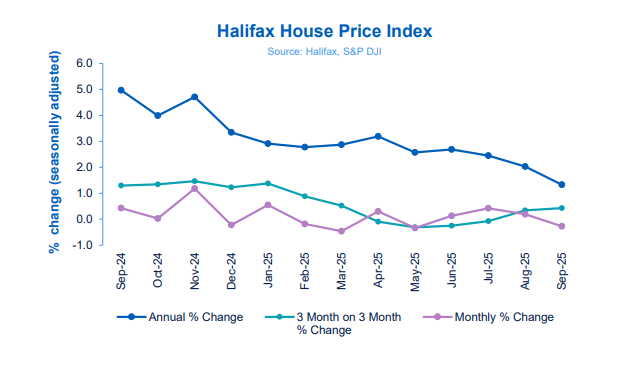
- Annual rate of growth eases to +1.3% (down from +2.0% in August)
- Northern Ireland continues to lead annual house price growth in the UK
Amanda Bryden, Head of Mortgages, Halifax, said:
“The average UK house price edged down by -0.3% (£794) in September, following a modest rise in August. The typical home now costs £298,184. Over the past 12 months prices have grown by +1.3%, the slowest annual rate since April 2024.
“This slight monthly dip in house prices reflects a housing market that has remained broadly stable, prices are up +0.3% since the start of the year. “It’s also important to remember that prices vary widely depending on characteristics like location and property type. As a result, many homes are available at a cost well below this headline figure.
For example, for those looking to take their first step on the property ladder, the typical first-time buyer home costs £236,811, up +1.7% year on year, with pockets of even greater affordability to be found across different regions.
“While affordability remains a challenge, a relatively lower mortgage rate environment and steady wage growth have helped support buyer confidence.
“Although the broader economic outlook remains uncertain, with the affordability picture gradually improving, we continue to expect modest growth through the remainder of the year.”
Nations and regions house prices
Northern Ireland once again lead the fastest annual property price inflation, with average property values up +6.5% over the past year (down from +7.9% last month). The typical home now costs £216,496, though prices remain well below the UK average.
Scotland recorded annual price growth of +4.5% in September to an average of £215,588. In Wales, property values rose a modest +1.9% year-on-year to £227,845.
In England, the North East, recorded the strongest annual growth with prices up +4.8% to £180,443, followed by the North West (+3.9).
The South West saw a second consecutive price fall by -0.2% over the past year (previously -0.7%) with prices now £303,067.
Meanwhile, prices are up only very slightly on the year in London (+0.6%) and the South East (+0.2%), with the capital the most expensive part of the UK, with an average property value of £543,497.
Housing activity
- HMRC monthly property transaction data show UK home sales decreased in August 2025. UK seasonally adjusted (SA) residential transactions in August 2025 totalled 93,630 – down by -1.7% from July’s figure of 95,240 (up +2.3% on a non-SA basis). Quarterly SA transactions (June 2025 – August 2025) were approximately -13.1% lower than the preceding three months (March 2025 – May 2025). Year-on-year SA transactions were +1.7% higher than August 2024 (-1.4% lower on a non-SA basis). (Source: HMRC)
- Latest Bank of England figures show the number of mortgages approved to finance house purchases decreased in August 2025 by -0.7% to 64,680. Year-on-year the figure was -0.5% below August 2024. (Source: Bank of England, seasonally-adjusted figures)
- The RICS Residential Market Survey results for August 2025 show a continued slowdown in sales market activity. New buyer enquiries recorded a net balance of -17% (down from -7%) and agreed sales -24% (down from -17%). New instructions have fallen into negative territory for the first time since June 2024 with a net balance of -3% (+8% previously). (Source: Royal Institution of Chartered Surveyors (RICS) monthly report)
 Kindly shared by Halifax


