UK property prices: The places UK homebuyers can get the most for their money
New research, undertaken by PlumbNation, reveals whereabouts in the UK homebuyers can get the most in a property for their money.
The research analysed the figures on average property prices compared to the average size of a home in each area around the country.
Where in the UK do homebuyers get the most for their money?
Having spent so much time stuck indoors over the last couple of years has led many homebuyers to cast their nets slightly wider in their property searches in the hope of having a bit more space.
To find out the areas where you get the most ‘bang for your buck’ when it comes to buying a new home, we’ve analysed the figures on average property prices compared to the average size of a home in each area around the country.
So where are the places where your money will stretch the furthest, and where might you have to compromise a little when it comes to size?
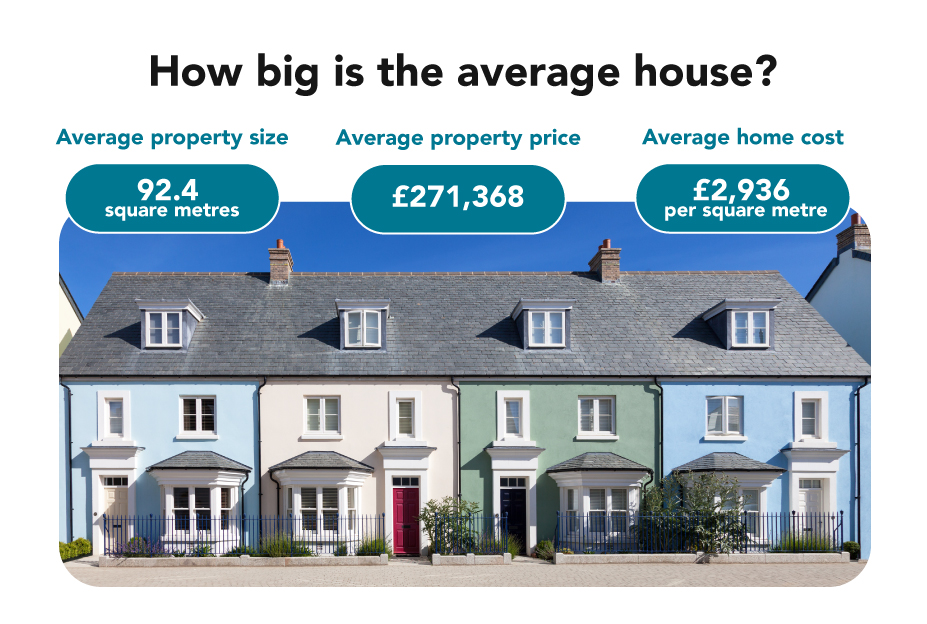
How big is the average house?
To give a bit of context as to how the house sizes below compare to the rest of the country, the average property size across each local authority in England and Wales stands at 92.4 square metres.
With an average property price across the nation of £271,368, this means that the average home has a cost of £2,936 per square metre.
But just how much does this vary around the country? The answer is quite a lot!
The cheapest areas per square metre
First looking at the places where you can buy the biggest homes for the lowest prices, we can see that the North of England dominates the picture, with three-quarters of the top 20 authorities being located in the North, with none from the South.
| Rank | Local authority | Average house price | Median floor space (sq m) | Average cost per square metre |
| 1 | Blaenau Gwent | £121,739 | 96 | £1,268 |
| 2 | Burnley | £112,394 | 88 | £1,277 |
| 3 | Hyndburn | £122,510 | 95 | £1,290 |
| 4 | Pendle | £118,671 | 91 | £1,304 |
| 5 | County Durham | £124,667 | 94 | £1,326 |
| 6 | Blackpool | £127,286 | 90 | £1,414 |
| 7 | North East Lincolnshire | £139,504 | 97 | £1,438 |
| 8 | Merthyr Tydfil | £138,102 | 96 | £1,439 |
| 9 | Blackburn with Darwen | £135,650 | 94 | £1,443 |
| 10 | Copeland | £139,946 | 96 | £1,458 |
The area where buyers get the greatest value for money in terms of floor space is Blaenau Gwent, in Wales, where a square metre of property costs just £1,268 on average.
The English area with the lowest cost per square metre is Burnley, in Lancashire, which is actually the cheapest place in the country. Combined with an average property size of 88 square metres, this equals a cost per square foot of just £1,277, which is over 20 times lower than some parts of central London.
One of Burnley’s neighbouring areas takes third place, with Hyndburn having slightly more expensive houses, but ones that are crucially bigger, with an average cost per square metre of £1,290.
The most expensive areas per square metre
At the other end of the scale, the areas where your money will stretch the least are largely found in the South of England, specifically in London, with each of the twelve least affordable areas found in the capital, and 18 of the top 20. The most expensive area per square metre not to be found in the South was Stratford-on-Avon, way down in 88th place.
| Rank | Local authority | Average house price | Median floor space (sq m) | Average cost per square metre |
| 1 | Kensington and Chelsea | £1,425,437 | 50 | £28,509 |
| 2 | Westminster | £1,004,433 | 48 | £20,926 |
| 3 | City of London | £806,489 | 47 | £17,159 |
| 4 | Camden | £800,815 | 50 | £16,016 |
| 5 | Islington | £711,601 | 52 | £13,685 |
| 6 | Wandsworth | £634,297 | 57 | £11,128 |
| 7 | Hackney | £551,940 | 51 | £10,822 |
| 8 | Lambeth | £542,961 | 52 | £10,442 |
| 9 | Southwark | £520,982 | 51 | £10,215 |
| 10 | Haringey | £615,720 | 68 | £9,055 |
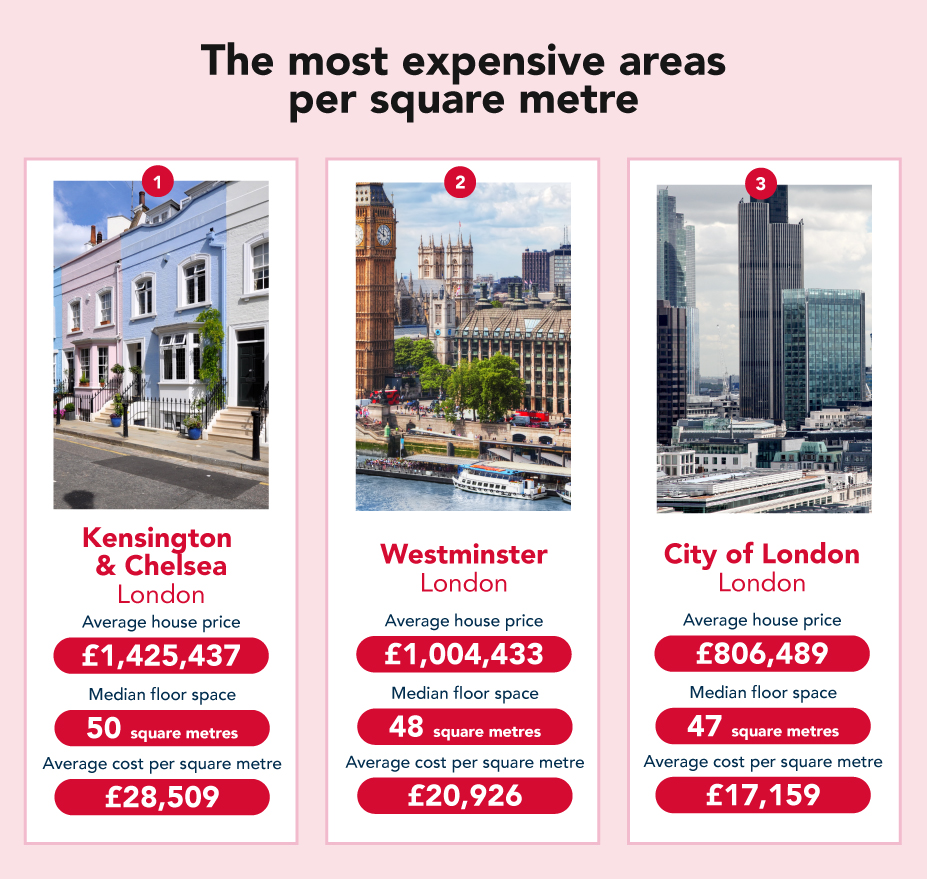
As by far the most expensive place in the country, it’s no surprise that the area where your money will get you the least floor space is Kensington & Chelsea, in London. Located in Central London, it is the capital’s smallest borough, with an average home value of £1.4 million.
Another Central London area takes second place, with Westminster having an average cost per square metre of over £20,000.
The City of London district has the smallest homes in the country, at an average floor space of just 47 square metres and also has the third-highest cost per square metre at £17,159.
The most expensive areas per square metre outside of London
With so many of the most expensive areas per square metre being located in the capital, here are the highest-ranking areas outside of London (although not too far outside!).
| Rank | Local authority | Average house price | Median floor space (sq m) | Average cost per square metre |
| 1 | Elmbridge | £711,017 | 100 | £7,110 |
| 2 | Mole Valley | £581,137 | 99 | £5,870 |
| 3 | Three Rivers | £560,759 | 97 | £5,781 |
| 4 | St Albans | £558,314 | 98 | £5,697 |
| 5 | Waverley | £552,960 | 100 | £5,530 |
| 6 | Hertsmere | £510,005 | 93 | £5,484 |
| 7 | Tandridge | £533,336 | 100 | £5,333 |
| 8 | Cambridge | £468,671 | 88 | £5,326 |
| 9 | Epping Forest | £494,040 | 94 | £5,256 |
| 10 | Guildford | £502,145 | 96 | £5,231 |
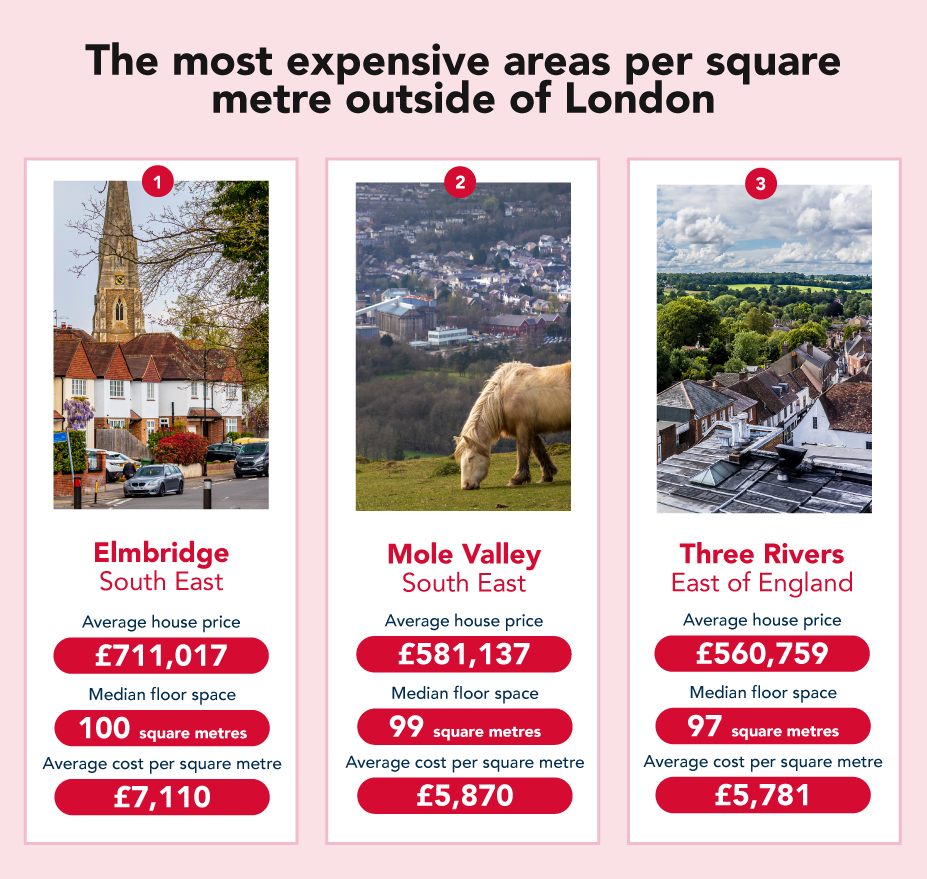
By far the most expensive non-London area is Elmbridge, in Surrey, with an average cost of £7,110 per square metre, which is over £1,000 more expensive than the next highest area.
Another Surrey district comes in second place, with houses in Mole Valley costing an average of £5,870 per square metre.
The district of Three Rivers, in Hertfordshire, came third, with an average house price per square metre of £5,781. As with the other two areas in the top three, Three Rivers is located just outside of London, with its major town being Rickmansworth.
Kindly shared by PlumbNation
Main article photo courtesy of Pixabay


