


UK housing market shows resilience as prices edge higher in March – Halifax House Price Index
The UK housing market is showing resilience as prices edge higher, according to the Halifax House Price Index for March.
Key points from publication:
-
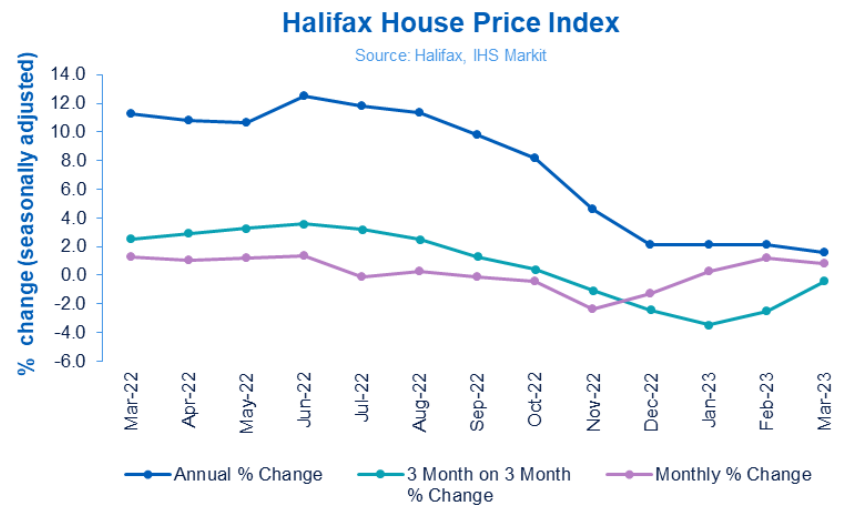
- Average house price increased by +0.8% in March (following +1.2% rise in February)
- Annual rate of house price growth slowed to +1.6% (vs +2.1% for previous three months in a row)
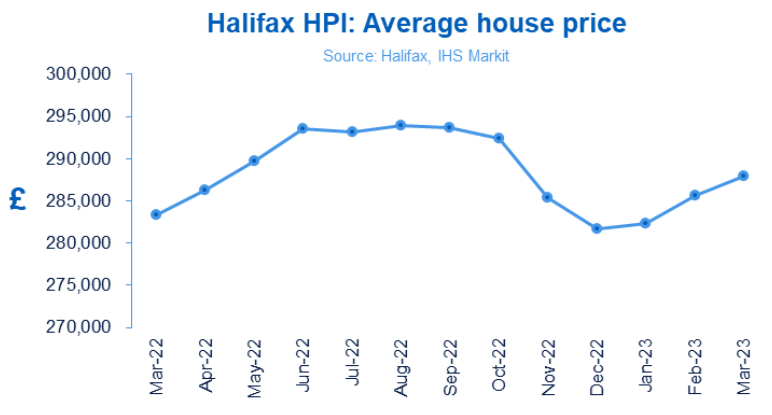
- Typical UK property now costs £287,880 (compared to £285,660 in February)
- House prices rose in all UK nations and regions last month, though the annual rate of growth continued to slow in most areas
Key metrics:
|
Average house price |
Monthly change |
Quarterly change |
Annual change |
|
£287,880 |
+0.8% |
-0.4% |
+1.6% |
Kim Kinnaird, Director, Halifax Mortgages, said:
“The UK housing market continues to show resilience following the sharp downturn at the end of 2022, with average property prices rising again in March (+0.8%).
“The typical house price is now £287,880, around 2% below the peak reached last August.
“On an annual basis, house prices were +1.6% higher than a year ago, slowing from +2.1% in February. This is the weakest rate of annual growth in nearly three-and-a-half years (October 2019), having fallen markedly since June 2022’s peak of +12.5%.
“However, overall these latest figures continue to suggest relative stability in the housing market at the start of 2023 and align with many other recent industry surveys and data.
“This has been characterised by a partial recovery in activity and transactions, especially when compared to the significant drops seen at the end of last year, with latest Bank of England data showing mortgage approvals rising for the first time in six months.
“The principal factor behind this improved picture has been an easing of mortgage rates. The sudden spike in borrowing costs that we saw in November and December has now been largely reversed, and while rates remain much higher than the average of the last decade, across the industry a typical five-year fixed rate deal (75% LTV) is down by more than 100 basis points over the last few months.
“It’s also important to recognise that the labour market, a key indicator for house prices, remains strong, with unemployment at a historical low of 3.7%, and pay growth continues to look robust.
“Predicting exactly where house prices go next is more difficult. While the increased cost of living continues to put significant pressure on personal finances, the likely drop in energy prices – and inflation more generally – in the coming months should offer a little more headroom in household budgets.
“While the path for interest rates is uncertain, mortgage costs are unlikely to get significantly cheaper in the short-term and the performance of the housing market will continue to reflect these new norms of higher borrowing costs and lower demand.
“Therefore, we still expect to see a continued slowdown through this year.”
Nations and regions house prices:
The average house price edged up in all the UK nations and regions during March. However, with the exceptions of Greater London and the North East, all areas of the country experienced a slowdown in the rate of annual house price inflation.
Northern Ireland continues to report the strongest annual growth in house prices of +4.9% (average house price of £186,459), followed by the West Midlands (+3.8%, average property price of £248,308).
In Wales, the rate of annual property price inflation has slowed to +1.0% (average house price of £213,959). Similarly in Scotland, the annual rate of growth fell to +2.3% (average property price of £199,853).
Average house prices in London are up very slightly on this time last year (+0.1%) with the typical property now costing £537,250.
Housing activity:
-
- HMRC monthly property transaction data shows UK home sales decreased in February 2023. UK seasonally adjusted (SA) residential transactions in February 2023 were 90,340 – down by 4.1% from January’s figure of 94,240 (up 1.8% on a non-SA basis). Quarterly SA transactions (December 2022-February 2023) were approximately 9.2% lower than the preceding three months (September 2022 – November 2022). Year-on-year SA transactions were 18.2% lower than February 2022 (18.2% lower on a non-SA basis). (Source: HMRC)
- Latest Bank of England figures show the number of mortgages approved to finance house purchases increased in February 2023, by 9.8% to 43,536. Year-on-year the February figure was 37% below February 2022. (Source: Bank of England, seasonally-adjusted figures)
- The February 2023 RICS Residential Market Survey results show key metrics remain negative but less so than previously. New buyer enquiries returned a net balance of -29%, up from -45% previously. Agreed sales had a net balance of -26% (-36% previously) and new instructions returned a net balance of -4% (previously -12%). (Source: Royal Institution of Chartered Surveyors’ (RICS) monthly report)
UK house prices Historical data National: All Houses, All Buyers (Seasonally Adjusted):
|
Period |
Index Jan 1992=100 |
Standardised Average Price £ |
Monthly change % |
Quarterly change % |
Annual change % |
|
March 2022 |
488.5 |
283,305 |
1.3 |
2.5 |
11.3 |
|
April |
493.6 |
286,242 |
1.0 |
2.9 |
10.8 |
|
May |
499.5 |
289,666 |
1.2 |
3.3 |
10.7 |
|
June |
506.3 |
293,586 |
1.4 |
3.6 |
12.5 |
|
July |
505.5 |
293,173 |
-0.1 |
3.2 |
11.8 |
|
August |
507.0 |
293,992 |
0.3 |
2.5 |
11.4 |
|
September |
506.4 |
293,664 |
-0.1 |
1.3 |
9.8 |
|
October |
504.2 |
292,406 |
-0.4 |
0.4 |
8.2 |
|
November |
492.2 |
285,425 |
-2.4 |
-1.1 |
4.6 |
|
December |
485.8 |
281,713 |
-1.3 |
-2.4 |
2.1 |
|
January 2023 |
486.9 |
282,360 |
0.2 |
-3.5 |
2.1 |
|
February |
492.6 |
285,660 |
1.2 |
-2.5 |
2.1 |
|
March |
496.4 |
287,880 |
0.8 |
-0.4 |
1.6 |
Next publication:
The Halifax House Price Index for April will be published at 7:00 a.m. on Tuesday 9th May 2023.
Kindly shared by Halifax
Main article photo courtesy of Pixabay


