


UK house prices fall as market continues to cool – Halifax House Price Index
UK house prices fall as market continues to cool, according to the latest Halifax House Price Index, covering October.
Key points from publication:
-
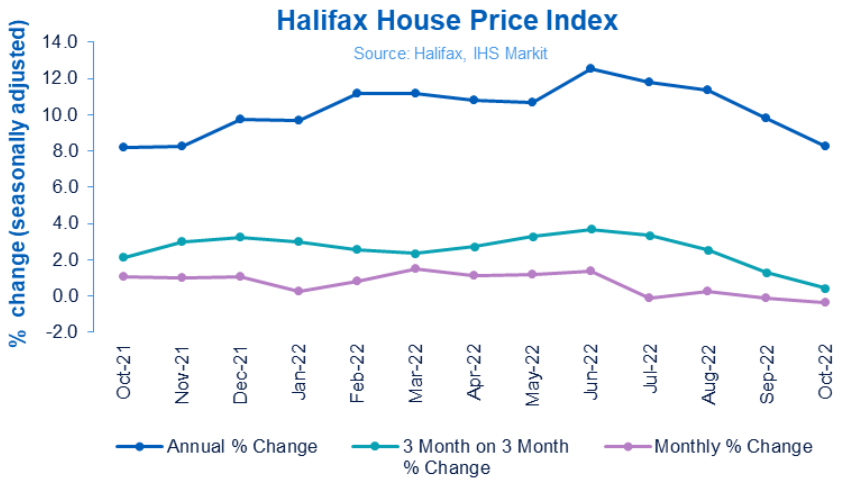
- Average house prices fell by -0.4% in October (vs. -0.1% in September)
- Annual rate of growth dropped to +8.3% (from +9.8%)
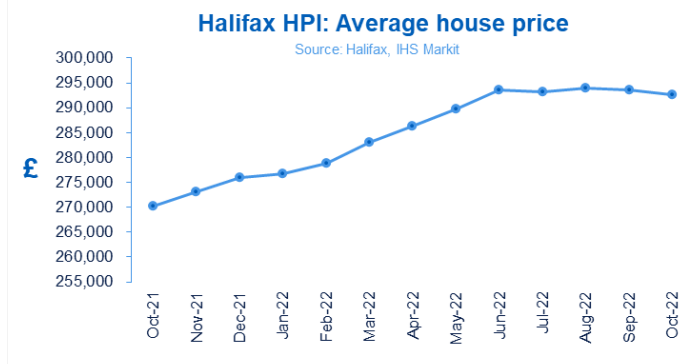
- Typical UK property now costs £292,598 (down from £293,664 last month)
- Rate of growth slowed in all but one region in England during October
- Similar slowing trend in Northern Ireland, Scotland, and Wales
|
Average house price |
Monthly change |
Quarterly change |
Annual change |
|
£292, 598 |
-0.4% |
+0.4% |
+8.3% |
Kim Kinnaird, Director, Halifax Mortgages, said:
“Average house prices fell in October, the third such decrease in the past four months. The drop of -0.4% is the sharpest we have seen since February 2021, taking the typical property price to a five-month low of £292,598. While the pace of annual growth also continued to ease, to +8.3% compared to +9.8% in September, average prices remain near record highs.
“Though the recent period of rapid house price inflation may now be at an end, it’s important to keep this is context, with average property prices rising more than £22,000 in the past 12 months, and by almost £60,000 (+25.7%) over the last three years, which is significant.
“While a post-pandemic slowdown was expected, there’s no doubt the housing market received a significant shock as a result of the mini-budget which saw a sudden acceleration in mortgage rate increases. While it is likely that those rates have peaked for now – following the reversal of previously announced fiscal measures – it appears that recent events have encouraged those with existing mortgages to look at their options, and some would-be homebuyers to take a pause.
“Understandably we have also seen consumer caution grow, as industry data shows mortgage approvals and demand for borrowing declining. The rising cost of living coupled with already stretched mortgage affordability is expected to continue to weigh on activity levels. With tax rises and spending cuts expected in the Autumn Statement, economic headwinds point to a much slower period for house prices.
“While certain longer-term, structural market factors which support higher house prices – like the shortage of available properties for sale – are likely to remain, how significantly prices might ultimately adjust will also be determined by the performance of the labour market.
“Currently joblessness remains historically low, but with growing expectations of the UK entering a recession, unemployment is expected to rise. Whilst it may not spike to the same extent as seen in previous downturns, history tells us that how this picture develops in the coming months will be a key determinant of house price performance into next year and beyond.”
First-time buyers vs homemovers:
Property price inflation weakened across all buyer types during October, with annual price growth among homemovers falling to +8.9% from +10.3% in September.
More notable was the drop in property prices for first-time buyers. Annual growth fell to +7.5% in October from +10.1% in September. Given the greater challenges for first-time buyers in deposit-raising, plus tighter requirements for higher loan-to-value mortgages, the relatively faster slowdown in prices is not surprising.
Nations and regions house prices:
All English regions with the exception of the North East experienced weaker annual price inflation during October compared to September. However the West Midlands now has the joint highest annual growth of any UK region at +11.7% (average property price of £254,962) down from +13.2% the previous month.
Wales saw the same rate of annual growth at +11.7%, though this was a fall from +14.4% (average property cost of £222,852).
Scotland has also seen it’s pace of annual house price inflation slow to +7.5% (from +8.3%) with a typical property now costing £203,820.
House prices in Northern Ireland are up +9.5% year-on-year, easing back from +10.9% last month. At £184,440 the average house price remains some £46,500 below its pre-financial crisis peak in mid-2007.
The pace of annual property price inflation also slowed in London, which continues to lag the other UK regions and nations. House prices have risen +6.8% over the last 12 months. However, given the cost of the capital’s average property (£551,320), London still recorded the biggest cash increase of any UK region over the past year (+£34,900).
Housing activity:
-
- HMRC monthly property transactions data shows UK home sales increased in September 2022. UK seasonally adjusted (SA) residential transactions in September 2022 were 103,930 – up by 0.2% from August’s figure of 103,720 (down 0.2% on a non-SA basis). Quarterly SA transactions (July-September 2022) were approximately 0.6% lower than the preceding three months (April 2022 – June 2022). Year-on-year SA transactions were 36.8% lower than September 2021 (32.2% lower on a non-SA basis). (Source: HMRC)
- Latest Bank of England figures show the number of mortgages approved to finance house purchases decreased in September 2022, by 10.3% to 66,789. Year-on-year the September figure was 7.3% below September 2021. (Source: Bank of England, seasonally-adjusted figures)
- The latest RICS Residential Market Survey in September continues to show a loss in momentum in the sales market. New buyer enquiries fell for a fifth month in a row to a net balance of -36%, compared to -38% previously. Agreed sales had a net balance of -27% (-22% previously) and new instructions returned a net balance score of – 13% (previously -15%). (Source: Royal Institution of Chartered Surveyors’ (RICS) monthly report)
UK house prices (Historical data National: All Houses, All Buyers (Seasonally Adjusted)):
|
Period |
Index Jan 1992=100 |
Standardised average price £ |
Monthly change % |
Quarterly change % |
Annual change % |
|
October |
466.0 |
270,248 |
1.1 |
2.1 |
8.2 |
|
November |
470.8 |
273,028 |
1.0 |
3.0 |
8.2 |
|
December |
475.9 |
275,996 |
1.1 |
3.2 |
9.7 |
|
January 2022 |
477.0 |
276,645 |
0.2 |
3.0 |
9.7 |
|
February |
480.9 |
278,894 |
0.8 |
2.6 |
11.2 |
|
March |
488.0 |
283,001 |
1.5 |
2.4 |
11.1 |
|
April |
493.6 |
286,242 |
1.2 |
2.7 |
10.8 |
|
May |
499.5 |
289,666 |
1.2 |
3.3 |
10.7 |
|
June |
506.3 |
293,586 |
1.4 |
3.7 |
12.5 |
|
July |
505.5 |
293,173 |
-0.1 |
3.3 |
11.8 |
|
August |
507.0 |
293,992 |
0.3 |
2.5 |
11.4 |
|
September |
506.4 |
293,664 |
-0.1 |
1.3 |
9.8 |
|
October |
504.6 |
292,598 |
-0.4 |
0.4 |
8.3 |
Kindly shared by Halifax
Main article photo courtesy of Pixabay


