


UK House Price Index October 2020 from HM Land Registry
The UK House Price Index October 2020 data shows house price changes for England, Scotland, Wales and Northern Ireland over the year to October 2020.
Main points:
- UK average house prices increased by 5.4% over the year to October 2020, up from 4.3% in September 2020, to stand at a record high of £245,000; this is the highest annual growth rate the UK has seen since October 2016.
- Average house prices increased over the year in England to £262,000 (5.4%), Wales to £176,000 (5.8%), Scotland to £163,000 (6.0%) and Northern Ireland to £143,000 (2.4%).
- The East Midlands, North West and Yorkshire and The Humber experienced the joint highest annual growth in average house prices (6.6%).
- The Office for National Statistics (ONS) has released a public statement on the coronavirus (COVID-19) and the production of statistics; Section 7: Measuring the data describes the situation in relation to the UK House Price Index (HPI).
UK house prices
UK average house prices increased by 5.4% over the year to October 2020.
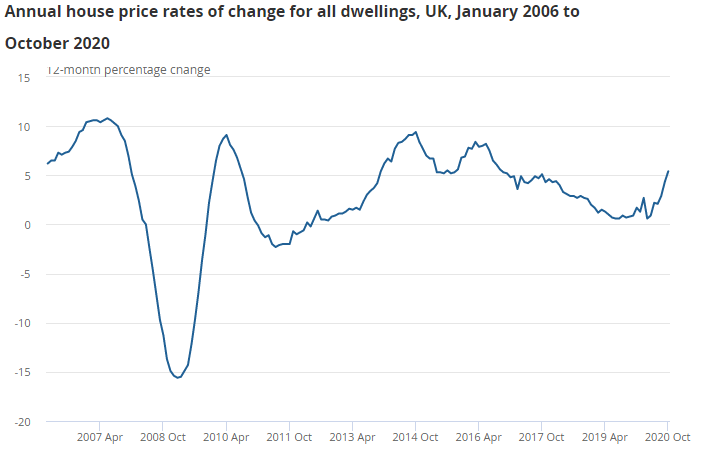
The latest house price data published on GOV.UK by HM Land Registry for October 2020 show that average house prices in the UK increased by 5.4% in the year to October 2020, up from 4.3% in the year to September 2020 (Figure 1).
During July 2020, changes were made to Stamp Duty Land Tax, Land Transaction Tax and Land and Buildings Transaction Tax. The UK House Price Index (HPI) is based on completed housing transactions. Typically, a house purchase can take six to eight weeks to reach completion. Therefore, the price data feeding into the October 2020 UK HPI will reflect those agreements that occurred after the tax changes took place.
Because of the impact of the coronavirus (COVID-19) pandemic on both the number and supply of housing transactions, we might see larger revisions to the published HPI estimates than usual. Further information on this can be found in Section 7: Measuring the data.
Figure 1: October 2020 saw UK house price growth at its highest level since October 2016
Source: HM Land Registry, Registers of Scotland, Land and Property Services Northern Ireland, and Office for National Statistics – UK House Price Index
Notes:
1. Not seasonally adjusted.
2. The full UK House Price Index (HPI) release is available to download from HM Land Registry at GOV.UK.
Over the past four years, there has been a general slowdown in UK house price growth, driven mainly by a slowdown in the south and east of England. The beginning of 2020 saw a pick-up in annual growth in the housing market before the coronavirus restrictions were put in place at the end of March 2020.
Price variations at the beginning of 2020 may reflect the unusual conditions in the housing market at the time. People were advised not to move house during the tightest restrictions in April and May. As such, property transactions completed during that time may have been more concentrated than usual among those without complicating factors, such as a chain. For example, first-time buyers – typically at the lower end of the price scale – may have been freer to complete transactions than former owner-occupiers, who may have had to co-ordinate multiple sales during lockdown.
Recent price increases may reflect a range of factors including pent-up demand, some possible changes in housing preferences since the pandemic and a response to the changes made to property transaction taxes across the nations.
Pent-up demand may have contributed towards an increase in house prices. The Bank of England’s Money and Credit October 2020 release reported that mortgage approvals for house purchases (an indicator of future lending) increased further in October 2020 to 97,500, the highest since September 2007.
The pandemic may have also caused house buyers to reassess their housing preferences. In our UK HPI data, we have seen the average price of detached properties increase by 6.8% in the year to October, in comparison to flats and maisonettes increasing by 2.3% over the same period.
On 8 July 2020, the Chancellor of the Exchequer announced a suspension of the tax paid on property purchases with immediate effect in England and Northern Ireland, coming into effect slightly later, on 15 July in Scotland and 27 July in Wales. In England and Northern Ireland properties up to the value of £500,000 would incur no tax, while the thresholds for Scotland and Wales were £250,000. The tax holiday is due to end on 31 March 2021 across the whole of the UK. This may allow sellers to request higher prices as buyers’ overall costs are reduced.
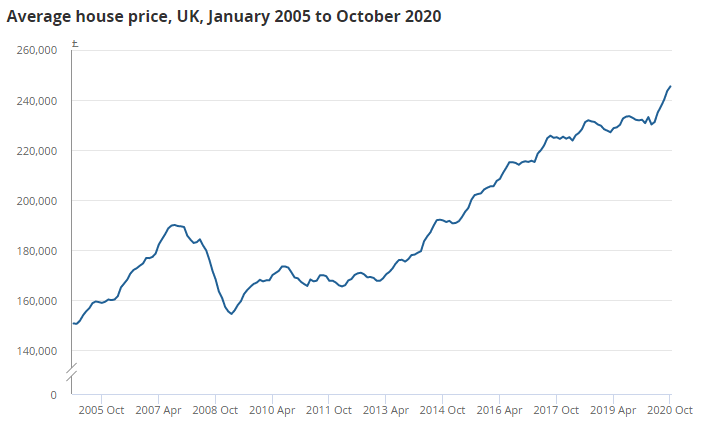
Figure 2: Average UK house prices peaked at £245,000 in October 2020
Source: HM Land Registry, Registers of Scotland, Land and Property Services Northern Ireland, and Office for National Statistics – UK House Price Index
Notes:
1. Not seasonally adjusted.
2. The full UK House Price Index (HPI) release is available to download from HM Land Registry at GOV.UK.
The average UK house price was £245,000 in October 2020; this is £13,000 higher than in October 2019 (Figure 2).
On a non-seasonally adjusted basis, average house prices in the UK increased by 0.7% between September and October 2020, compared with a decrease of 0.3% in the same period a year ago.
On a seasonally adjusted basis, average house prices in the UK increased by 0.9% between September and October 2020, following an increase of 1.5% in the previous month.
House prices by country
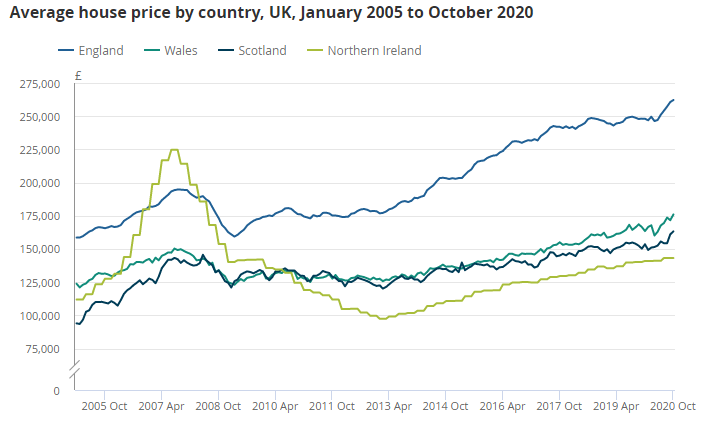
Figure 3: England house prices remain the highest in the UK
Source: HM Land Registry, Registers of Scotland, Land and Property Services Northern Ireland, and Office for National Statistics – UK House Price Index
Notes:
1. Not seasonally adjusted.
2. The full House Price Index (HPI) release is available to download from HM Land Registry at GOV.UK.
3. Northern Ireland data are only available on a quarterly basis. Northern Ireland data are copied forward until the next quarter’s data are available, which will be in the December 2020 bulletin to be released on 17 February 2021.
England, Scotland and Wales all saw record high average prices in October 2020. Northern Ireland’s average house price in Quarter 3 (July to Sept) 2020 is the highest since Quarter 4 (Oct to Dec) 2008.
The average house price in Scotland increased by 6.0% over the year to October 2020, up from an increase of 4.0% in the year to September 2020, with the average house price in Scotland now at £163,000.
House price growth in Wales increased by 5.8% over the year to October 2020, up from 4.4% in September 2020, with the average house price in Wales at £176,000.
The average house price in England increased by 5.4% over the year to October 2020, up from 4.4% in the year to September 2020, with the average house price in England now at £262,000.
The average house price in Northern Ireland increased by 2.4% over the year to Quarter 3 (July to Sept) 2020. Northern Ireland remains the cheapest UK country to purchase a property in, with the average house price at £143,000 (Figure 3).
House prices by region
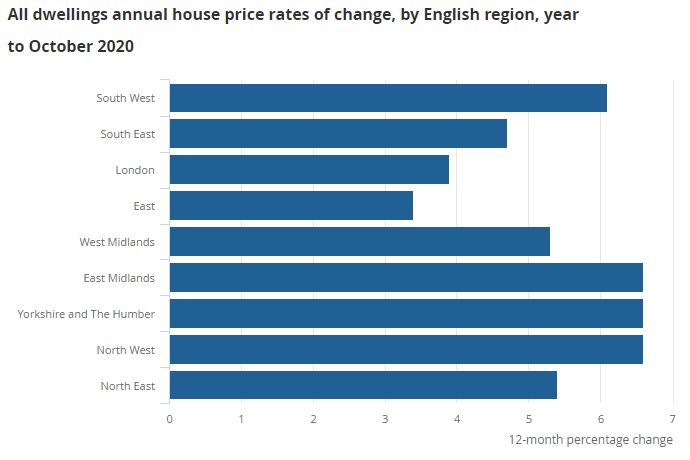
Figure 4: The lowest regional house price growth was in the East of England
Source: HM Land Registry and Office for National Statistics – UK House Price Index
Notes:
1. Not seasonally adjusted.
2. The full UK House Price Index (HPI) release is available to download from HM Land Registry at GOV.UK.
The East Midlands, North West and Yorkshire and The Humber were the English regions with the joint highest annual house price growth, with average prices increasing by 6.6% in the year to October 2020. These were up from 4.5% (East Midlands), 5.1% (North West) and 4.6% (Yorkshire and The Humber) in the year to September 2020 (Figure 4).
The lowest annual growth was in the East of England, where average prices increased by 3.4% over the year to October 2020.
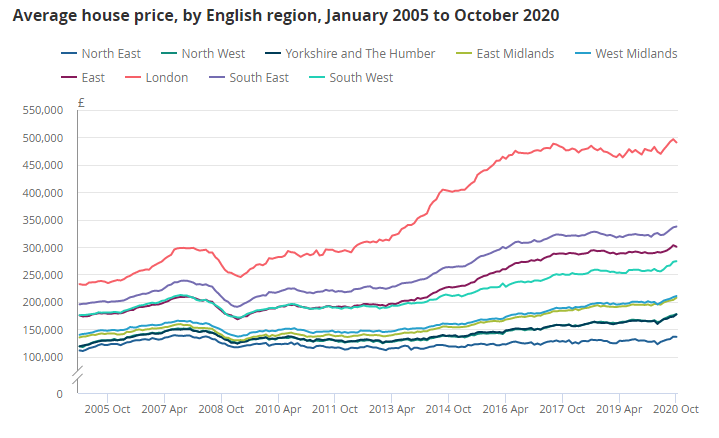
London house prices remained the most expensive at an average of £491,000. The North East continued to have the lowest average house price, at £136,000, and is the only English region yet to surpass its pre-economic downturn peak of July 2007 (Figure 5).
Figure 5: The North East is the only English region yet to surpass its pre-economic downturn peak of July 2007
Source: HM Land Registry and Office for National Statistics – UK House Price Index
Notes:
1. Data at the local authority level and other breakdowns can be found in the full House Price Index (HPI) release, available to download from HM Land Registry at GOV.UK.
House Price Index data
UK House Price Index
Dataset | Released 16 December 2020
Monthly house price movements, including average price by property type, sales and cash mortgage sales, as well as information on first-time buyers, new builds and former owner occupiers. Data are collected by HM Land Registry and published on GOV.UK.
House price data: quarterly tables
Dataset | Released 18 November 2020
Quarterly house price data based on a sub-sample of the Regulated Mortgage Survey and an unrevised arithmetic mean version of the mix adjusted House Price Index (HPI) for Great Britain.
House price data: annual tables 20 to 39
Dataset | Released 19 August 2020
Annual house price data based on a sub-sample of the Regulated Mortgage Survey.
Kindly shared by HM Land Registry
Main article photo courtesy of Pixabay


