


Price of average UK home fell in December – Halifax House Price Index
The price of the average UK home fell in December, according to the latest publication of the Halifax House Price Index.
Key points from publication:
-
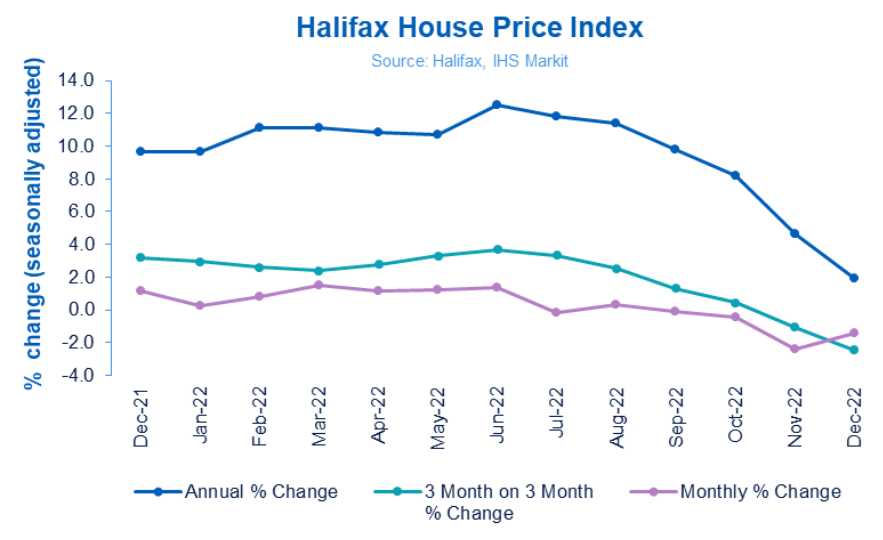
- Average house price fell by -1.5% in December (vs. -2.4% in November)
- Annual rate of growth dropped to +2.0% (from +4.6%)
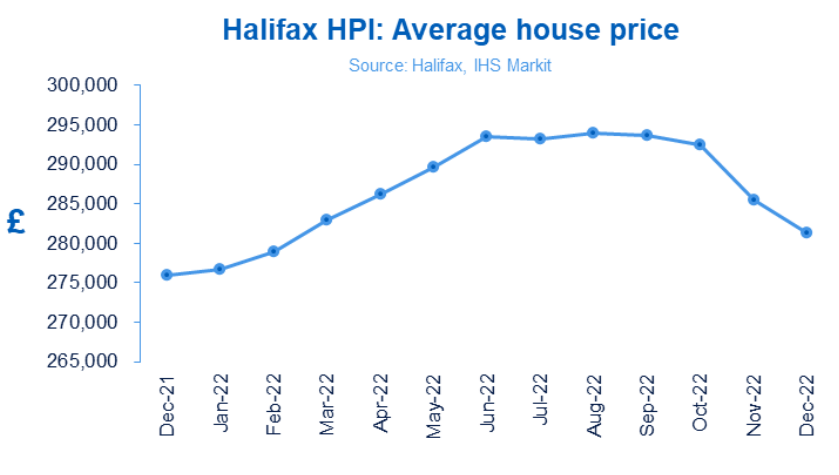
- Typical UK property now costs £281,272 (down from £285,425 last month)
- Rate of annual growth slowed in all nations and regions during December
- The Halifax House Price Index hits 40-year anniversary, with house prices up 974% since early 1983
|
Average house price |
Monthly change |
Quarterly change |
Annual change |
|
£281,272 |
-1.5% |
-2.5% |
+2.0% |
Kim Kinnaird, Director, Halifax Mortgages, said:
“In December, the cost of the average UK home was £281,272, a fall on the previous month of 1.5%, with annual growth slowing to +2% (from +4.6%). However, the fall in December was lower than the monthly decline of 2.4% recorded in November, even taking into account seasonal slowdown driven by the festive period.
“As we’ve seen over the past few months, uncertainties about the extent to which cost of living increases will impact household bills, alongside rising interest rates, is leading to an overall slowing of the market.
“The housing market was a mixed picture in 2022. We saw rapid house price growth during the first six months, followed by a plateau in the summer before prices began to fall from September, as the impact of cost of living pressures, coupled with a rising rates environment, began to take effect on household finances and demand.
“These trends need to be viewed in the context of historic prices. The cost of the average home remains high – greater than it was at the start of 2022 and over 11% more than house prices at the beginning of 2021. The first half of last year was a very strong period for sellers, between January 2022 and August 2022, the average cost of a home rose by over £17,000 to £293,992 (growth of 6%), setting a new record high.
“As we enter 2023, the housing market will continue to be impacted by the wider economic environment and, as buyers and sellers remain cautious, we expect there will be a reduction in both supply and demand overall, with house prices forecast to fall around 8% over the course of the year. It’s important to recognise that a drop of 8% would mean the cost of the average property returning to April 2021 prices, which still remains significantly above pre-pandemic levels.”
Nations and regions house prices
All nations and regions saw annual house price inflation, although the rate of growth has slowed.
On an annual basis, the North East saw the greatest slowdown in growth, with annual house prices rising by +6.5%, compared to +10.5% the prior month. Average house prices in the region are now £169,980.
Eastern England, West Midlands and Wales experienced the smallest falls in growth rate. Those buying in the East of England will now pay an average £337,215 (growth rate +5.5% vs +7.2% in November), while in the West Midlands average properties now cost £250,965 (growth rate +7.3% vs +9.1% in November). The average home in Wales is now £217,547, with annual growth now +6.1% (down from +7.7% the prior month).
Those buying in Scotland will find an average home now costs £200,166, with the second greatest slowdown in the annual growth in the UK, now +3.5% (from +6.4% last month).
Properties in Northern Ireland are up +7.1% year-on-year, lower than the +9.1% last month, with average homes now costing £183,825.
The cost of an average home in London in December was £541,239, a growth of +2.9% annually, compared to 5.0% last month.
Halifax House Price Index turns 40
The Halifax House Price Index was established in January 1983, when the average UK house price was £26,188 and Bank Base Rate was 11%*. Since then, average house prices have grown 974% to £281,272 and Bank Base Rate sits at 3.5%.
While the cost of buying a home was at its lowest when the Index began, looking over the past four decades, prices peaked in August 2022 at £293,992.
Regionally, London was the most expensive place to buy a home in early 1983, as it is today. Properties in the capital were an average £36,056 in the first three months of that year, compared to £541,239 today. Yorkshire and the Humber was the cheapest place to buy a property when the Index began (£20,332 vs £205,466 now), whereas the properties with the lowest average cost can now be found in the North East (£169,980 vs £21,494 in Q1 1983).
In Scotland, the average property in the first quarter of 1983 was £26,411 vs £200,166 today. In Wales, the average home now costs £217,547, compared to £21,388 forty years ago. For Northern Ireland, those buying in the first three months of 1983 needed £23,383 on average, today it is £183,825.
Housing activity:
-
- HMRC monthly property transaction data shows UK home sales increased in November 2022. UK seasonally adjusted (SA) residential transactions in November 2022 were 107,190 – up by 0.2% from October’s figure of 107,010 (up 4.3% on a non-SA basis). Quarterly SA transactions (September-November 2022) were approximately 3.3% higher than the preceding three months (June 2022 – August 2022). Year-on-year SA transactions were 13.3% higher than November 2021 (12.1% higher on a non-SA basis). (Source: HMRC)
- Latest Bank of England figures show the number of mortgages approved to finance house purchases decreased in November 2022, by 20.4% to 46,075. Year-on-year the November figure was 33.2% below November 2021. (Source: Bank of England, seasonally-adjusted figures)
- The November 2022 RICS Residential Market Survey results show overall activity across the sales market continues to weaken. New buyer enquiries was in a negative net balance for a seventh month at -38%, compared to -53% previously. Agreed sales had a net balance of -35% (-45% previously) and new instructions returned a net balance of -9% (previously -16%). (Source: Royal Institution of Chartered Surveyors’ (RICS) monthly report)
UK house prices Historical data – National: All Houses, All Buyers (Seasonally Adjusted):
|
Period |
Index Jan 1992=100 |
Standardised average price £ |
Monthly change % |
Quarterly change % |
Annual change % |
|
December |
475.7 |
275,889 |
1.1 |
3.2 |
9.7 |
|
January 2022 |
477.0 |
276,645 |
0.3 |
3.0 |
9.7 |
|
February |
480.9 |
278,894 |
0.8 |
2.6 |
11.2 |
|
March |
488.0 |
283,001 |
1.5 |
2.4 |
11.1 |
|
April |
493.6 |
286,242 |
1.2 |
2.8 |
10.8 |
|
May |
499.5 |
289,666 |
1.2 |
3.3 |
10.7 |
|
June |
506.3 |
293,586 |
1.4 |
3.7 |
12.5 |
|
July |
505.5 |
293,173 |
-0.1 |
3.3 |
11.8 |
|
August |
507.0 |
293,992 |
0.3 |
2.5 |
11.4 |
|
September |
506.4 |
293,664 |
-0.1 |
1.3 |
9.8 |
|
October |
504.2 |
292,406 |
-0.4 |
0.4 |
8.2 |
|
November |
492.2 |
285,425 |
-2.4 |
-1.1 |
4.6 |
|
December |
485.0 |
281,272 |
-1.5 |
-2.5 |
2.0 |
Kindly shared by Halifax
Main article photo courtesy of Pixabay


