Owning a home with a mortgage now more affordable than 10 years ago, despite house prices soaring by 29%
The average cost of repaying a mortgage – as a proportion of monthly income – is now more affordable than it was 10 years ago despite house prices rising 29% over the same period, new analysis from independent mortgage broker Private Finance reveals.
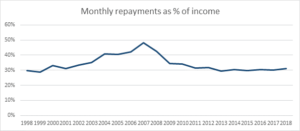
- Monthly mortgage payments as a proportion of income have dropped from 43% in 2008 to 31% in 2018, with the average borrower spending £104 less on monthly mortgage payments
- Over a 20-year period, payments have remained almost unchanged from 30% of income in 1998 to 31% in 2018
- This comes despite house prices soaring by 225% over the same period
- Falling mortgage rates and wage growth mean the cost of servicing a mortgage has remained stable even though buyers face larger loans
In 2008, the average borrower could expect their mortgage to account for two fifths (43%) of their monthly income (if purchasing alone), compared to 31% of monthly income in 2018.
In terms of actual payments, the average borrower is now saving £104 a month, with monthly repayments down from £804 to £700, a decrease of 13%. This is despite the average house price growing by £51,660 over the same period.
Over a 20-year period, the affordability of mortgages has remained broadly unchanged. In 1998, the average homeowner could expect to spend 30% of their monthly income on mortgage payments; 20 years later, this proportion is almost unchanged at 31%.
This is despite the average UK house price soaring by 225% over the same period, up from £70,313 in 1998 to £228,513 in 2018. House prices now represent 8.5 times annual income, compared to 4.7 times 20 years ago. As a result, the typical loan – based on a 75% loan-to-value (LTV) mortgage – has more than tripled from £52,735 to £171,384.
However, Private Finance’s analysis shows once buyers have made the upfront purchase for their home, the ongoing cost of ownership is broadly in line with levels seen in 1998.

Graph 1: Monthly payments as a % of income from 1998 to 2018
Table 1: Mortgage affordability (monthly repayments as a % of income)1
| 1998 | 2008 | 2018 | |
| Average loan | £52,735 | £132,640 | £171,384 |
| Average mortgage rate | 7.01% | 5.37% | 1.68% |
| Monthly mortgage payments | £373 | £804 | £700 |
| Monthly income | £1,261 | £1,887 | £2,249 |
| Monthly payments as % of income | 30% | 43% | 31% |
Falling rates and wage growth helps mortgage affordability remain stable
The minimal increase in the cost of owning a home, despite the significant rise in property values, is largely attributed to falling interest rates over the period.
Bank of England data reveals that in 1998, the average two-year fixed rate at 75% LTV was 7.01%, compared to just 1.68% in 2018.
Wage growth also has a role to play; while monthly mortgage repayments have increased by 88% from £373 in 1998 to £700 in 2018 – this increase has been offset by the rise in average earnings. Over the same period, average monthly earnings have increased by 78% from £1,261 to £2,249.
Table 2: House prices rise, but so do monthly earnings, while mortgage rates fall
| Average monthly earnings | Average house price | Average mortgage rate (basis points) | Monthly payments | Monthly repayments as % of income (percentage points) | |
| 20-year difference (1998-2018) | +78% | +225% | -5.3 | +88% | +1% |
| 10-year difference (2008-2018) | +19% | +29% | -3.7 | -13% | -12% |
Shaun Church, Director at Private Finance comments:
“News of the UK property market’s affordability crisis is never far from the headlines. What we often fail to acknowledge, however, is that thanks to falling rates, those with a mortgage today are in a similar – if not better – position than their predecessors, who owned property at a time when housing was considered vastly less expensive.
“With the value of property skyrocketing over the past 20 years, it’s undeniable that first time buyers today face a far greater challenge stepping onto the housing ladder. However, once buyers have raised their deposit, the ongoing cost of owning a home is less of a financial strain than that faced by buyers a decade earlier, and broadly in line with affordability levels seen 20 years ago when property values were much lower.
“Homeownership can be attainable. Those in a position to buy should shop around for the best rates on the market, to ensure they capitalise on the incredibly competitive rates currently on offer. Borrowers should also consider locking into these with a longer fixed term, to cushion themselves against any further rate rises and keep the monthly cost of ownership low for as long as possible.”
Private Finance’s calculations are based on a buyer purchasing alone. The analysis uses the following data sources:
- Average house price data from the ONS House Price Index (January 1998 – December 2018). An annual figure was produced by taking an average of 12 months of data for each year.
- Average earnings from the ONS Labour Market Survey (January 1998 – December 2018). Average monthly and annual earnings calculated from weekly data.
- Average rate for 2-year fixed mortgage 75% LTV from Bank of England quoted household interest rates data (January 1998 – December 2018).
- Average monthly mortgage repayments calculated using the Private Finance repayment calculator (based on a 25-year term).
Kindly shared by Private Finance


