


ONS: UK House Price Index for November 2023
The Office for National Statistics (ONS) publishes its UK House Price Index for November 2023, for England, Scotland, Wales and Northern Ireland.
Main points:
-
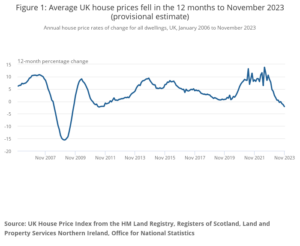
- Average UK house prices decreased by 2.1% in the 12 months to November 2023 (provisional estimate), down from a decrease of 1.3% (revised estimate) in the 12 months to October 2023.
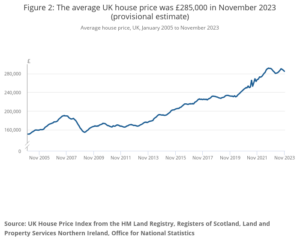
- The average UK house price was £285,000 in November 2023, which was £6,000 lower than 12 months ago.
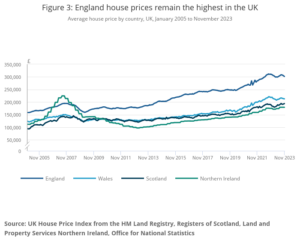
- Average house prices over the 12 months to November 2023 decreased in England to £302,000 (negative 2.9%), decreased in Wales to £213,000 (negative 2.4%), but increased in Scotland to £194,000 (2.2%).
- Average house prices increased by 2.1% to £180,000 in the year to Quarter 3 (July to Sept) 2023 in Northern Ireland.
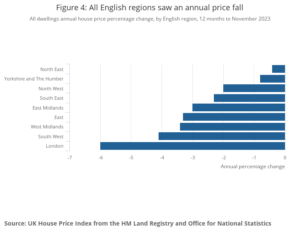
- The North East was the English region that saw the smallest decrease in average house prices in the 12 months to November 2023 (negative 0.4%), while London saw the largest fall (negative 6.0%).
These estimates are provisional and are subject to revision. All statistics are non-seasonally adjusted estimates, unless explicitly stated otherwise.
Note from ONS: Recently, the transaction volumes available to calculate UK House Price Index estimates have been considerably lower than historically. We and HM Land Registry are working to improve the balance between processing recently received and older applications. Revisions may be larger than usual in the coming months, especially for new-build breakdowns.
UK house prices:
The latest UK House Price Index data published on GOV.UK by HM Land Registry (HMLR) for November 2023 show that average UK house price annual inflation was negative 2.1% (provisional estimate) in the 12 months to November 2023. This was down from the revised estimate of negative 1.3% in the 12 months to October 2023 and is the largest annual fall since 2011.
UK house price annual inflation has been generally slowing since July 2022, when annual inflation was 13.8%. The provisional estimate for the average UK house price was £285,000 in November 2023, which is £6,000 lower than 12 months ago.
The coronavirus (COVID-19) pandemic affected the supply of housing transactions for a period of time, with the processing of new build properties particularly affected. To address this, in 2020 we introduced pooling for new build transactions for certain months in England and Wales, and in December 2023 we implemented a methodology improvement to the Great Britain model, which increased UK coherence and improved UK House Price Index (HPI) statistics quality.
While transaction volumes remain affected, revisions may be larger than usual and users are advised to note the substantially greater uncertainty around new build prices. More information is available in Section 7: Measuring the data and the UK HPI Quality and Methodology Information.
Graph notes:
Estimates are not seasonally adjusted.
The HMLR’s UK House Price Index (HPI) release on GOV.UK is available to download.
Volatility in 2021 and 2022 reflects house price movements around changes in Stamp Duty Land Tax in 2021.
The provisional seasonally-adjusted estimate for UK residential transactions in November 2023 was 80,780, reported in HM Revenue and Customs’ (HMRC’s) Monthly property transactions statistics. This provisional volume estimate for November 2023 is 22% lower than the revised estimate for November 2022 and 1% lower than the provisional estimate for October 2023.
Graph notes:
Estimates are not seasonally adjusted.
The HMLR’s UK House Price Index (HPI) release on GOV.UK is available to download.
House prices by country:
Graph notes:
Estimates are not seasonally adjusted.
The HMLR’s UK House Price Index (HPI) release on GOV.UK is available to download.
Northern Ireland (NI) data are only available on a quarterly basis; Northern Ireland data will be copied forward until next quarter’s data are available, which will be in the December 2023 bulletin released 14 February 2024.
Further information is available on Northern Ireland HPI publications and future release schedules.
The average house price in England decreased by 2.9% over the 12 months to November 2023 (provisional estimate). This is down from a decrease of 1.7% (revised estimate) in the 12 months to October 2023 and is the largest annual fall since 2009. The average house price in England was £302,000 in November 2023, which was £9,000 lower than 12 months ago.
The average house price in Scotland increased by 2.2% (provisional estimate) over the 12 months to November 2023, up from an increase of 0.5% (revised estimate) in the 12 months to October 2023. The average house price in Scotland was £194,000 in November 2023, which was £4,000 higher than 12 months ago.
The average house price in Wales decreased by 2.4% (provisional estimate) over the 12 months to November 2023, up from a decrease of 3.3% (revised estimate) in the 12 months to October 2023. The average house price in Wales was £213,000 in November 2023, which was £5,000 lower than 12 months ago.
The average house price in Northern Ireland increased by 2.1% (provisional estimate) over the year to Quarter 3 (July to Sept) 2023. Northern Ireland remains the cheapest country in the UK in which to purchase a property, with the average house price at £180,000.
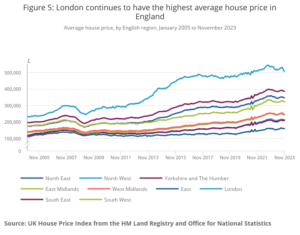
House prices by region in England:
Graph notes:
Estimates are not seasonally adjusted.
The HMLR’s UK House Price Index (HPI) release on GOV.UK is available to download.
London’s average house prices remain the most expensive of any region in the UK, with an average price of £505,000 in November 2023.
London is also the region with the lowest annual house price inflation, with average prices decreasing by 6.0% in the 12 months to November 2023. This is down from an annual inflation rate of negative 3.4% in the 12 months to October 2023 and is the lowest annual inflation rate since 2009. London’s annual inflation slowed in November 2023 because London prices fell between October and November 2023, while prices rose between the same months a year before.
The North-East continued to have the lowest average house price of all English regions, at £160,000 in November 2023.
The North-East is also the English region with the smallest annual house price fall in the 12 months to November 2023. Average house prices in the North-East decreased by 0.4% in the 12 months to November 2023.
Graph notes:
Estimates are not seasonally adjusted.
Data at the local authority level and other breakdowns can be found in the HMLR’s UK House Price Index (HPI) release on GOV.UK.
House Price Index data:
-
- UK House Price Index
Dataset | Released 17 January 2024
Monthly house price movements, including average price by property type, sales and cash mortgage sales, as well as information on first-time buyers, new builds and former owner occupiers. Data are collected by HM Land Registry, Registers of Scotland and Northern Ireland Land and Property Services, and published on GOV.UK. - House price data: quarterly tables
Dataset | Released 15 November 2023
Quarterly house price data based on a sub-sample of the Regulated Mortgage Survey. - House price data: annual tables 20 to 38
Dataset | Released 19 July 2023
Annual house price data based on a sub-sample of the Regulated Mortgage Survey.
- UK House Price Index
Kindly shared by The Office for National Statistics (ONS)


