ONS UK House Price Index for August 2022
The ONS has published its UK House Price Index for August 2022, calculated using data from HM Land Registry, Registers of Scotland, and Land and Property Services Northern Ireland.
1. Main points
-
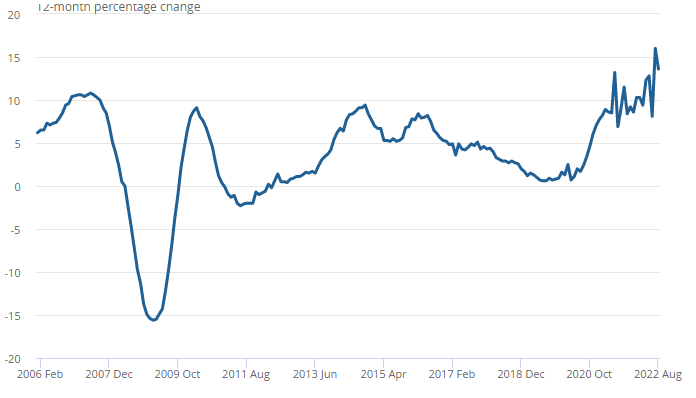
- UK average house prices increased by 13.6% over the year to August 2022, down from 16.0% in July 2022.
- Despite UK house prices increasing between July and August 2022, annual growth has slowed because of the sharp rise in house prices in August 2021 following changes in the stamp duty holiday.
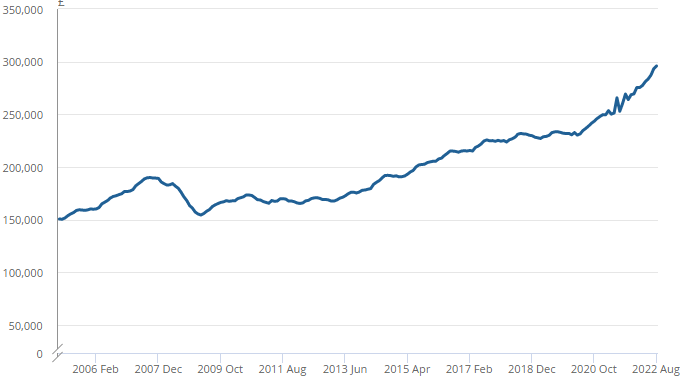
- The average UK house price was £296,000 in August 2022, which is £36,000 higher than this time last year.
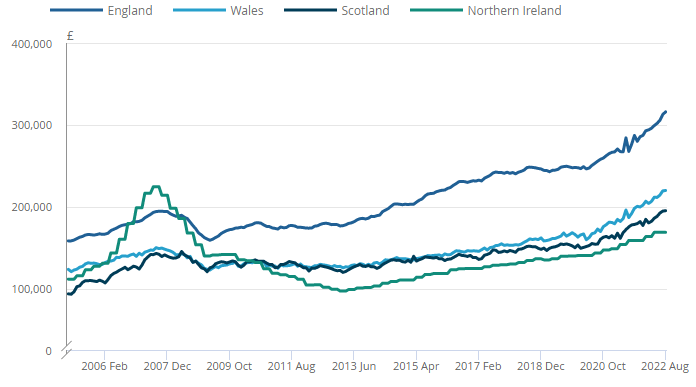
- Average house prices increased over the year to £316,000 (14.3%) in England, to £220,000 in Wales (14.6%), to £195,000 in Scotland (9.7%) and to £169,000 in Northern Ireland (9.6%).
2. UK house prices
UK average house prices increased by 13.6% over the year to August 2022
The latest house price data published on GOV.UK by HM Land Registry (HMLR) for August 2022 show that average house prices in the UK increased by 13.6% in the year to August 2022, down from 16.0% in the year to July 2022.
The coronavirus (COVID-19) pandemic affected the supply of housing transactions for a period of time. Therefore, while HMLR continue to process the backlog, revisions to the published UK House Price Index (HPI) estimates may be larger than usual. The total number of processed transactions feeding into this month’s release (including those from previous months, which are incorporated in line with our revisions policy) has increased compared with the numbers seen throughout the coronavirus pandemic period. While this indicates an improvement in the quality of the UK HPI estimates going forward, it may also result in revisions to previous months that are higher than usual, as more transactions are now available in our calculations. Further information on this can be found in Section 7, Measuring the data.
Figure 1: August 2022 saw UK house price growth slow to 13.6%:
Annual house price rates of change for all dwellings, UK, January 2006 to August 2022
Source: HM Land Registry, Registers of Scotland, Land and Property Services Northern Ireland, Office for National Statistics – UK House Price Index
Consistent price increases since early 2022 have resulted in a record average house price level in the UK of £296,000 in August 2022. The annual growth rate for average UK house prices for August 2022 was 13.6%, compared with 16.0% in the year to July 2022 and 8.1% in the year to June 2022. This is driven by the volatility seen in house prices throughout 2021 because of Stamp Duty holiday changes. For example, tax holiday changes at the end of June 2021 caused average house prices to fall £13,000 in the month to July 2021, followed by an increase of £7,000 into August 2021. There was a smaller increase of £3,000 between July and August 2022. This base effect, where prices are increasing by a smaller amount than the same period last year, has led to the slowing of annual growth this month. Trends in 2022 have been more stable.
On 8 July 2020, changes to the tax paid on property purchases were announced with immediate effect in England and Northern Ireland. Similar changes came into effect slightly later in Scotland and Wales (15 July and 27 July, respectively). In England and Northern Ireland, properties up to the value of £500,000 would incur no tax, while the thresholds for Scotland and Wales were £250,000. These changes in the tax paid on housing transactions may have allowed sellers to request higher prices as the buyers’ overall costs were reduced.
On 3 March 2021, an extension to the Stamp Duty holiday in England and Northern Ireland was announced. This meant that the tax holiday was extended until 30 June 2021, after which the threshold decreased to £250,000 until 30 September 2021. From 1 October 2021, the Stamp Duty thresholds have reverted to what they were before 8 July 2020. The tax holiday for Scotland ended on 31 March 2021. The tax holiday for Wales ended on 30 June 2021.
UK house prices experienced sharp, temporary rises in March 2021, June 2021 and September 2021. This corresponded with each of the original and extended end dates of the Stamp Duty holiday in UK nations. The final Stamp Duty holiday extension applied to England and concluded in September 2021. It is likely that average house prices were slightly inflated during these months as buyers rushed to complete their house purchases ahead of the Stamp Duty holiday deadlines.
The provisional seasonally adjusted estimate of UK residential transactions in August 2022 was 104,980, as shown in the Monthly property transactions statistics published by HM Revenue and Customs (HMRC). This is 7.6% higher than August 2021 and 1.1% higher than July 2022.
Figure 2: Average UK house price increased to £296,000 in August 2022:
Average house price, UK, January 2005 to August 2022
Source: HM Land Registry, Registers of Scotland, Land and Property Services Northern Ireland, Office for National Statistics – UK House Price Index
The average UK house price was £296,000 in August 2022; this is £36,000 higher than in August 2021.
On a non-seasonally adjusted basis, average house prices in the UK grew by 0.9% between July and August 2022. This compares with an increase of 3.0% during the same period a year earlier (July and August 2021).
On a seasonally adjusted basis, average house prices in the UK increased by 1.1% between July and August 2022, following an increase of 1.3% in the previous month. Prices increased by 3.3% between July and August 2021.
3. House prices by country
Figure 3: England house prices remain the highest in the UK:
Average house price by country, UK, January 2005 to August 2022
Source: HM Land Registry, Registers of Scotland, Land and Property Services Northern Ireland, Office for National Statistics – UK House Price Index
The average house price in Scotland increased by 9.7% over the year to August 2022, down from an increase of 11.0% in the year to July 2022. The average house price in Scotland was at a record level of £195,000 in August 2022.
The average house price in Wales increased by 14.6% over the year to August 2022, down from an increase of 17.4% in the year to July 2022. The average house price in Wales was at a record level of £220,000 in August 2022.
The average house price in England increased by 14.3% over the year to August 2022, down from an increase of 16.8% in the year to July 2022. The average house price in England was at a record level of £316,000 in August 2022.
The average house price in Northern Ireland increased by 9.6% over the year to Quarter 2 (Apr to Jun) 2022. Northern Ireland remains the cheapest UK country in which to purchase a property, with the average house price at £169,000.
4. House prices by region
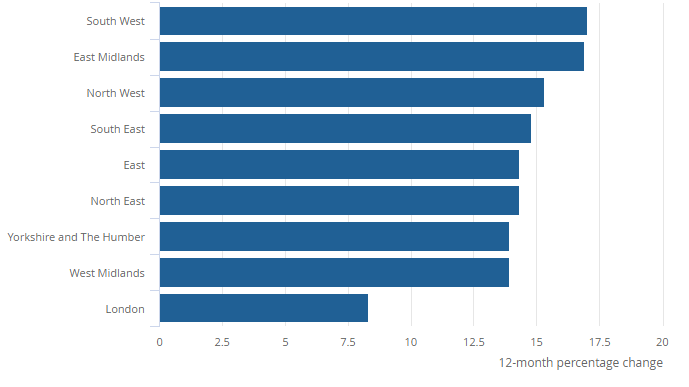
Figure 4: London is the region with the lowest annual house price growth:
All dwellings, annual house price rates of change, by English region, year to August 2022
Source: HM Land Registry and Office for National Statistics – UK House Price Index
The South-West was the region with the highest annual house price growth, with average prices increasing by 17.0% in the year to August 2022. This was down from a growth rate of 21.1% in July 2022.
The lowest annual house price growth was in London, where average prices increased by 8.3% over the year to August 2022, down from 10.1% in July 2022.
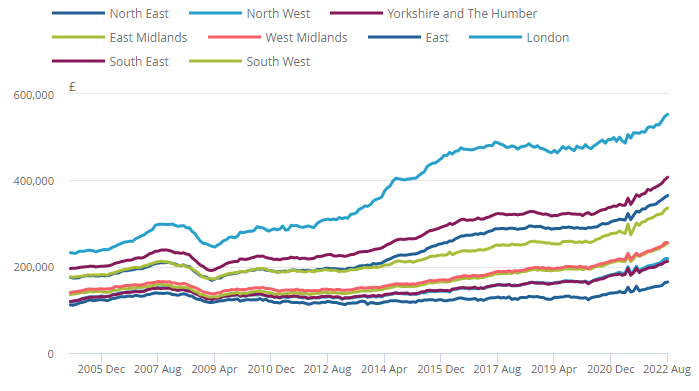
Despite having the lowest annual house price growth rate, London’s average house prices remain the most expensive of any region in the UK, with a record average price of £553,000 in August 2022.
The North-East continued to have the lowest average house price at £164,000 in August 2022, which is a record high for the region.
Figure 5: London continues to have the highest average house price in England:
Average house price, by English region, January 2005 to August 2022
Source: HM Land Registry and Office for National Statistics – UK House Price Index
Office for National Statistics (ONS), released 19 October 2022, ONS website, statistical bulletin, UK house price index: August 2022.
Kindly shared by Office for National Statistics (ONS)
Main article photo courtesy of Pixabay


