Office space shrinks by 1.5 million square metres in just one year
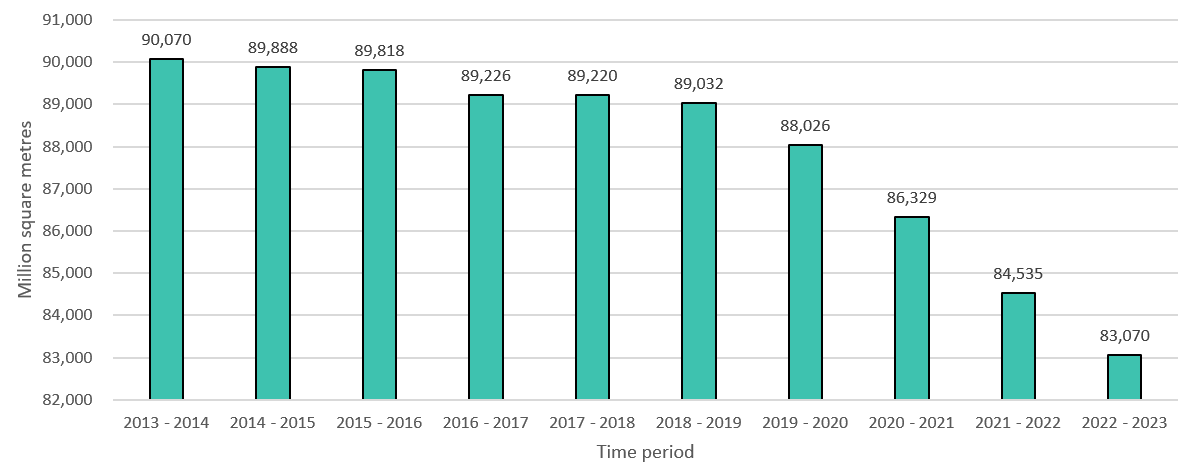
Leading property data provider, Search Acumen, has found 1.47 million square metres of office floorspace have been lost over the last year across England and Wales, equating to 1,200 Olympic sized swimming pools of space which is no longer in use.
Key points:
-
- 47 million square metres of office space lost in England and Wales since 2022
- Shrinkage is equivalent to losing 1,200 Olympic sized swimming pools
- Post-pandemic office space is nearly 5 million square metres smaller than before the pandemic, with 6% of space lost since 2019/20
The findings come from analysis of the latest Valuation Office Agency (VOA) government dataset for 2022/23, which reveals annual movements and trends in the availability and use of office space.
It shows 4.95 million square metres of office space have disappeared since 2019/20, with almost as much lost in the last two years alone than the previous eight years combined (3.2 million vs. 3.4 million).
FIGURE 1 – Stock of office space in England and Wales over the last 10 years (in thousand metres squared):
The office exodus continues even after the pandemic recedes
Comparing local areas, the City of London experienced the largest decline in office space over the last year, with a loss of 166,000 square metres of space. Nearly half of the top ten local areas which experienced the greatest reduction in floorspace are based in London [see Figure 2].
Looking at percentage changes in office floorspace over the last year, the areas that have experienced the largest decrease from 2021/22 to 2022/23 include [see Figure 3]:
-
- Hart in Hampshire: fell by over 28% from 141,000 square metres to 101,000 square metres
- Hastings: lost around 20% of office floorspace, dropping from 84,000 to 67,000 square metres
- Worthing: shrank by 18% to 92,000 square metres from 112,000
In contrast, the areas which have experienced the largest percentage increase include [see Figure 4]:
-
- Broxborne: increased 29% to 75,000 square metres from 58,000
- Gosport: up 19% to 25,000 square metres from 21,000
- Torfaen: up 8% to 90,000 square metres from 83,000
Andy Sommerville, Director of Search Acumen, says:
“Search Acumen’s analysis suggests office space was declining even before the onset of the pandemic as the use of flexible and remote working spread.
“Having staff work from home more often has hugely accelerated this trend and the end of pandemic restrictions has done little to slow the rate of decline, with office space disappearing almost four times as fast in the last two years as the previous eight.
“Workers have largely maintained productivity levels despite new hybrid working patterns, which will discourage some firms from reverting back to full-time office mandates.
“This could also trigger firms to cut their real estate footprint even further or diversify their model through co-working spaces.
“As office requirements continue to evolve, quality office space over quantity remains today’s dominant trend.”
FIGURE 2 – Top 10 local areas with the largest overall decrease in office space over the last year:
|
Rank |
Area |
Change in office space over the last year (in thousand square metres) |
|
1 |
City of London |
-166 |
|
2 |
Westminster |
-124 |
|
3 |
Manchester |
-61 |
|
4 |
Hillingdon |
-55 |
|
5 |
Tower Hamlets |
-47 |
|
6 |
Buckinghamshire UA |
-45 |
|
7 |
Bradford |
-44 |
|
8 |
Bracknell Forest UA |
-43 |
|
9 |
Hart |
-40 |
|
10 |
Crawley |
-38 |
FIGURE 3 – Top 10 areas with the largest percentage decrease in office space over the last year:
|
Rank |
Area |
% change in office space over the last year |
|
1 |
Hart |
-28% |
|
2 |
Hastings |
-20% |
|
3 |
Worthing |
-18% |
|
4 |
Waverley |
-15% |
|
5 |
Enfield |
-14% |
|
6 |
Harlow |
-13% |
|
7 |
Bracknell Forest UA |
-12% |
|
8 |
Slough UA |
-12% |
|
9 |
Crawley |
-11% |
|
10 |
Rossendale |
-10% |
FIGURE 4 – Top 10 areas with the largest percentage increase in office space over the last year:
|
Rank |
Area |
% change in office space over the last year |
|
1 |
Broxbourne |
29% |
|
2 |
Gosport |
19% |
|
3 |
Torfaen/Tor-faen |
8% |
|
4 |
Cambridge |
8% |
|
5 |
Solihull |
7% |
|
6 |
Rhondda Cynon Taf |
6% |
|
7 |
East Riding of Yorkshire UA |
6% |
|
8 |
Rochford |
6% |
|
9 |
Braintree |
5% |
|
10 |
Harborough |
5% |
Kindly shared by Search Acumen
Main article photo courtesy of Pixabay


