


Halifax HPI: UK house prices remained stable in June
The Halifax HPI for June 2024 has been published, showing that UK house prices have remained stable for the month.
Key points from publication:
-
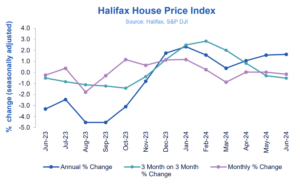
- Average house prices largely flat in June, down by just -0.2% on a monthly basis
- Annual rate of house price growth unchanged from last month at +1.6%
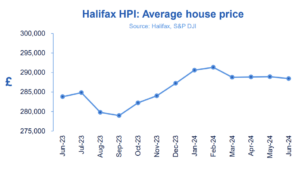
- Typical UK home now costs £288,455 (compared to £288,931 in May)
- Northern Ireland records the strongest annual house price growth in the UK
Key indicators:
|
Average house price |
Monthly change |
Quarterly change |
Annual change |
|
£288,455 |
-0.2% |
-0.5% |
+1.6% |
Amanda Bryden, Head of Mortgages, Halifax, said:
“UK house prices stayed relatively flat for the third successive month in June, with the slight fall equivalent to less than £500 in cash terms.
“On an annual basis, house prices posted a seventh consecutive month of year-on-year growth, with the average UK property value now standing at £288,455.
“This continued stability in house prices – rising by just +0.4% so far this year – reflects a market that remains subdued, though overall activity has been recovering.
“For now, it’s the shortage of available properties, rather than demand from buyers, that continues to underpin higher prices.
“Mortgage affordability is still the biggest challenge facing both homebuyers and those coming to the end of fixed-term deals.
“This issue is likely to be eased gradually, through a combination of lower interest rates, rising incomes, and more restrained growth in house prices.
“While in the short-term the housing market is delicately balanced and sensitive to the pace of change to Base Rate, based on our current expectations property prices are likely to rise modestly through the rest of this year and into 2025.”
Nations and regions house prices:
Northern Ireland recorded the strongest property price growth of any nation or region in the UK, rising by +4.0% on an annual basis in June, up from +3.3% the previous month. The average price of a property in the country is now £192,457.
In England, the steepest rate of house price inflation is found in the North-West, up by +3.8% over the last year, now standing at £231,351.
House prices in Scotland also increased, with a typical property now costing £204,663, +1.6% more than the year before. In Wales, house prices grew annually by +2.7% to reach £220,197.
Eastern England was the only region or nation across the UK to register a decline in house prices over the last year, where they now average £328,747, down -0.9% in June on an annual basis.
London continues to have the most expensive property prices in the UK, now averaging £536,306, up (+0.9%) compared to last year.
Housing activity:
-
- HMRC monthly property transaction data shows UK home sales increased in May 2024 compared to the previous month. UK seasonally adjusted (SA) residential transactions in May 2024 totalled 91,290 – up by +2.4% from April’s figure of 89,160 (up +18.3% on a non-SA basis). Quarterly SA transactions (March 2024 – May 2024) were approximately +7.1% higher than the preceding three months (December 2023 – February 2024). Year-on[1]year SA transactions were +17.2% higher than May 2023 (+23.8% higher on a non-SA basis). (Source: HMRC)
- Latest Bank of England figures show the number of mortgages approved to finance house purchases decreased slightly in May 2024, by -1.4% to 59,991. Year-on-year the figure was +19.2% above May 2023. (Source: Bank of England, seasonally-adjusted figures)
- The RICS Residential Market Survey results for May 2024 show a slowing down in sales and demand. New buyer enquiries have fallen to a negative net balance of -8%, down from -1%, with agreed sales also down to -13% from +4%. New instructions reported its sixth consecutive positive reading of +16% (down from +25%). (Source: Royal Institution of Chartered Surveyors (RICS) monthly report)
UK house prices Historical data National: All Houses, All Buyers (Seasonally Adjusted):
|
Period |
Index Jan 1992=100 |
Standardised average price £ |
Monthly change % |
Quarterly change % |
Annual change % |
|
June 2023 |
489.4 |
283,804 |
-0.2 |
-0.5 |
-3.3 |
|
July |
491.2 |
284,852 |
0.4 |
-0.8 |
-2.5 |
|
August |
482.5 |
279,793 |
-1.8 |
-1.1 |
-4.5 |
|
September |
481.1 |
278,985 |
-0.3 |
-1.2 |
-4.5 |
|
October |
486.7 |
282,221 |
1.2 |
-1.4 |
-3.1 |
|
November |
489.8 |
284,039 |
0.6 |
-0.4 |
-0.8 |
|
December |
495.3 |
287,244 |
1.1 |
1.2 |
1.8 |
|
January 2024 |
501.1 |
290,608 |
1.2 |
2.5 |
2.3 |
|
February |
502.4 |
291,338 |
0.3 |
2.8 |
1.6 |
|
March |
498.0 |
288,781 |
-0.9 |
2.0 |
0.4 |
|
April |
498.1 |
288,862 |
0.0 |
0.8 |
1.1 |
|
May |
498.2 |
288,931 |
0.0 |
-0.3 |
1.6 |
|
June |
497.4 |
288,455 |
-0.2 |
-0.5 |
1.6 |
Next publication:
The next Halifax House Price Index for July 2024 will be published at 07:00 on Wednesday, 7 August 2024.
Kindly shared by Halifax


