Halifax HPI: UK house prices flat in May as annual growth turns negative
Halifax have published their House Price Index for May 2023, showing UK house prices were flat in May as annual growth turned negative.
Key points from publication:
-
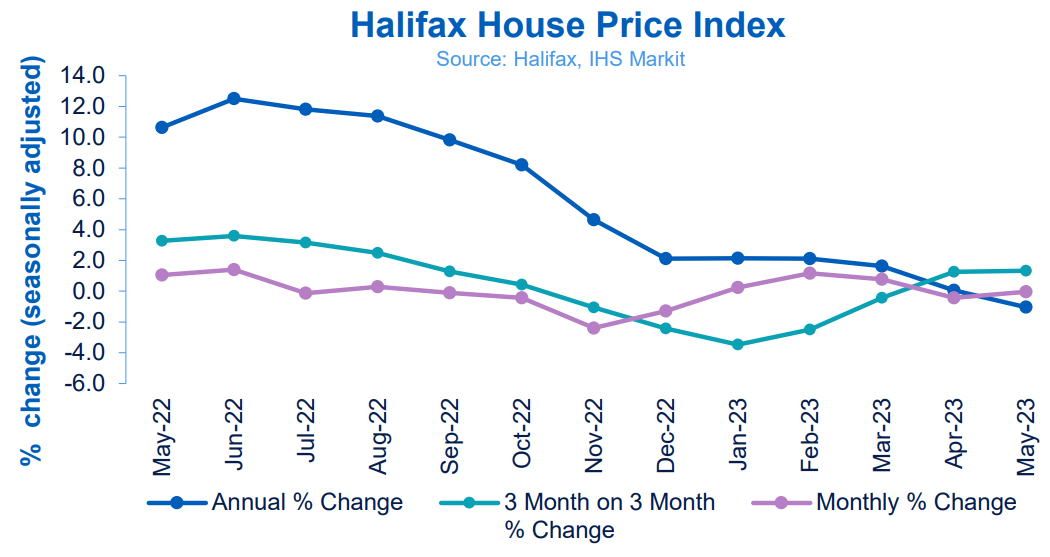
- Average house price remained flat (0.0%) in May (following -0.4% fall in April)
- Annual rate of house price growth fell to -1.0% (vs +0.1% in April)
- First annual decline in house prices since December 2012 (when -0.1%)
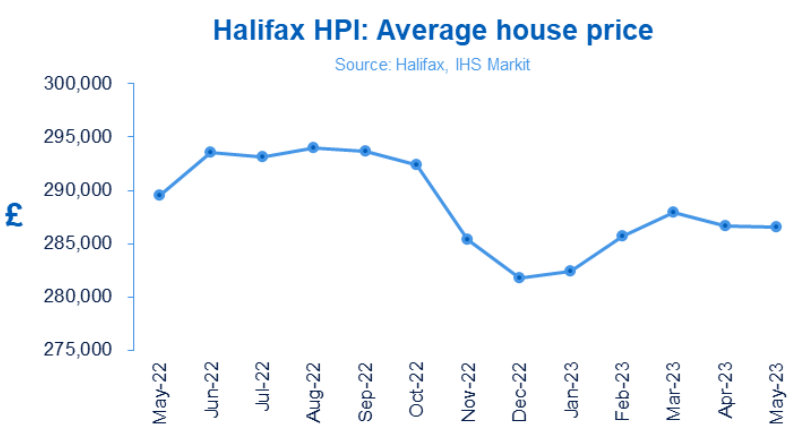
- Typical UK property now costs £286,532 (compared to £286,662 in April)
- Detached properties continue to post modest house price growth
- House prices in the south of England remain under the greatest pressure
Key indicators:
|
Average house price |
Monthly change |
Quarterly change |
Annual change |
|
£286,532 |
0.0% |
+1.3% |
-1.0% |
Kim Kinnaird, Director, Halifax Mortgages, said:
“House prices were largely unchanged in May, edging down very slightly (-£130) compared to April, with the average UK property now costing £286,532.
“More notably the annual rate of growth fell to -1.0%, marking the first time since 2012 that house prices have fallen year-on-year.
“Given the effectively flat month, the annual decline largely reflects a comparison with strong house prices this time last year, as the market continued to be buoyant heading into the summer.
“Property prices have now fallen by about £3,000 over the last 12 months and are down around £7,500 from the peak in August.
“But prices are still £5,000 up since the end of last year, and £25,000 above the level of two years ago.
“As expected the brief upturn we saw in the housing market in the first quarter of this year has faded, with the impact of higher interest rates gradually feeding through to household budgets, and in particular those with fixed rate mortgage deals coming to an end.
“With consumer price inflation remaining stubbornly high, markets are pricing in several more rate rises that would take Base Rate above 5% for the first time since the start of 2008.
“Those expectations have led fixed mortgage rates to start rising again across the market.
“This will inevitably impact confidence in the housing market as both buyers and sellers adjust their expectations, and latest industry figures for both mortgage approvals and completed transactions show demand is cooling.
“Therefore further downward pressure on house prices is still expected.
“One continued source of support to house prices is the labour market.
“While unemployment has recently ticked up from very low levels, brisk wage growth would over time help to improve housing affordability, if sustained.”
Buyer and property types:
Prices remain under most pressure among homemovers. Annual growth fell by -1.1% in May, compared to ongoing marginal inflation for first-time buyers (+0.3%).
Existing houses continued to fall in value (annual growth of -1.9%), whereas prices for new build properties are still rising (+2.8%), although at the weakest rate for nearly three years.
By property type, all except for detached houses (+0.4%) have registered year-on-year declines. The sharpest drop is for flats (-1.9%), followed by terraced (-1.0%) and semi-detached houses (-0.5%).
Nations and regions house prices:
Prices continue to fall on an annual basis across southern England, again led by the South East (-1.6%, average price £385,943), and closely followed by the South West (-1.4%, average price £301,079). In Greater London prices are down over the last year by -1.2% (average price £536,622).
Except for Wales (unchanged at +1.1%, average price £218,365), all areas of the UK have seen annual house price growth weaken in May compared to April, with most now recording a low single-digit rate of property price inflation.
The West Midlands (+2.7%, average price £251,137) remains the best performing region, followed by Yorkshire andHumberside (+2.3%, average price £205,035).
Scotland (average price £201,596) saw annual growth drop to +1.3% (from +2.2% in April). In Northern Ireland (average price £187,334) growth was +1.5% over the last year (from +2.7% in April).
Housing activity:
-
- HMRC monthly property transaction data shows UK home sales decreased in April 2023. UK seasonally adjusted (SA) residential transactions in April 2023 totalled 82,120 – down by 7.9% from March’s figure of 89,210 (down 29.2% on a non-SA basis). Quarterly SA transactions (February 2023 – April 2023) were approximately 11.6% lower than the preceding three months (November 2022 – January 2022). Year-on-year SA transactions were 25.1% lower than April 2022 (32.5% lower on a non-SA basis). (Source: HMRC)
- Latest Bank of England figures show the number of mortgages approved to finance house purchases decreased in April 2023, by 5.4% to 48,690. Year-on-year the April figure was 26.0% below April 2022. (Source: Bank of England, seasonally-adjusted figures)
- The April 2023 RICS Residential Market Survey results continue to show weak momentum in the sales market. New buyer enquiries returned a net balance of -37%, down from -30% in each of the last two months. Agreed sales had a net balance of -19% (up from -30% previously) and new instructions returned a net balance of -4% (previously -6%). (Source: Royal Institution of Chartered Surveyors’ (RICS) monthly report)
UK house prices Historical data National: All Houses, All Buyers (Seasonally Adjusted):
|
Period |
Index Jan 1992=100 |
Standardised average price £ |
Monthly change % |
Quarterly change % |
Annual change % |
|
May 2022 |
499.3 |
289,541 |
1.1 |
3.3 |
10.6 |
|
June |
506.3 |
293,586 |
1.4 |
3.6 |
12.5 |
|
July |
505.5 |
293,173 |
-0.1 |
3.1 |
11.8 |
|
August |
507.0 |
293,992 |
0.3 |
2.5 |
11.4 |
|
September |
506.4 |
293,664 |
-0.1 |
1.3 |
9.8 |
|
October |
504.2 |
292,406 |
-0.4 |
0.4 |
8.2 |
|
November |
492.2 |
285,425 |
-2.4 |
-1.1 |
4.6 |
|
December |
485.8 |
281,713 |
-1.3 |
-2.4 |
2.1 |
|
January 2023 |
486.9 |
282,360 |
0.2 |
-3.5 |
2.1 |
|
February |
492.6 |
285,660 |
1.2 |
-2.5 |
2.1 |
|
March |
496.4 |
287,891 |
0.8 |
-0.4 |
1.6 |
|
April |
494.3 |
286,662 |
-0.4 |
1.3 |
0.1 |
|
May |
494.1 |
286,532 |
0.0 |
1.3 |
-1.0 |
Next publication:
The next Halifax House Price Index for June 2023 will be published at 07:00 on Friday 7 July 2023.
Kindly shared by Halifax
Main article photo courtesy of Pixabay


