Halifax HPI: Slight monthly fall in property prices but housing market displays resilience
The Halifax HPI for July 2023 has been published, showing a slight monthly fall in property prices but housing market displaying resilience.
Key points from publication:
-
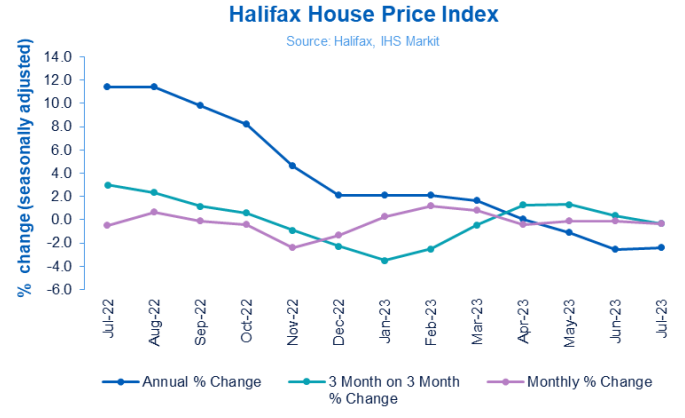
- Average house price fell by -0.3% in July, a fourth consecutive monthly decline
- Property prices dropped by -2.4% on an annual basis, easing from -2.6% in June
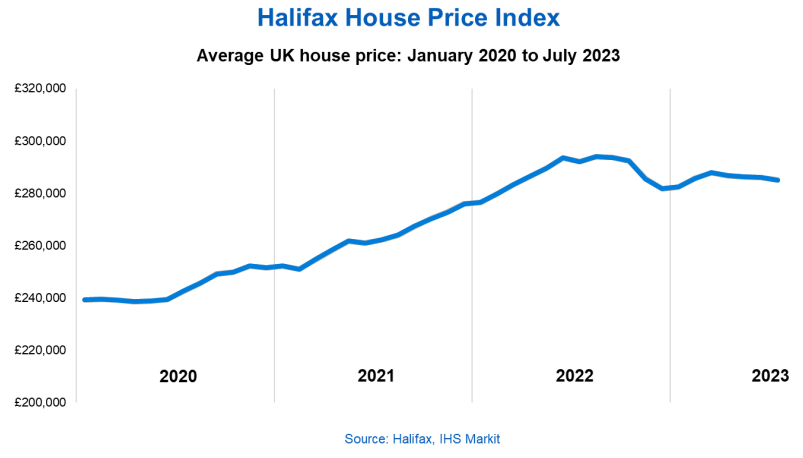
- Typical UK home now costs £285,044 (vs peak of £293,992 last August)
- Market displaying some resilience with industry data showing increased activity
- Southern England and Wales see most downward pressure on property prices
Key indicators:
|
Average house price |
Monthly change |
Quarterly change |
Annual change |
|
£285,044 |
-0.3% |
-0.3% |
-2.4% |
Kim Kinnaird, Director, Halifax Mortgages, said:
“Average UK house prices edged down slightly in July, with the monthly fall of -0.3% equivalent to a drop of around £1,000 in cash terms.
“While this was the fourth consecutive monthly decrease, all have been smaller than -0.5%.
“In reality, prices are little changed over the last six months, with the typical property now costing £285,044, compared to £285,660 in February.
“The pace of annual decline also slowed to -2.4% in July, versus -2.6% in June.
“These figures add to the sense of a housing market which continues to display a degree of resilience in the face of tough economic headwinds.
“In particular, we’re seeing activity amongst first-time buyers hold up relatively well, with indications some are now searching for smaller homes, to offset higher borrowing costs.
“Conversely the buy-to-let sector appears to be under some pressure, though elevated interest rates are just one factor impacting landlords’ business models, together with considerations of future rental market reforms.
“It remains to be seen how many may choose to exit and what that could mean for the supply of properties available to buy.
“Prospects for the UK housing market remain closely linked to the performance of the wider economy.
“Several factors are providing support, notably strong wage growth, running at around +7% annually.
“And, while the uptick in unemployment is likely to restrain that somewhat, it seems unlikely to reach levels that would trigger a sharp deterioration in conditions.
“Expectations of further Base Rate increases from the Bank of England were tempered by a better-than expected inflation report for June.
“However, while there have been recent signs of borrowing costs stabilising or even falling, they will likely remain much higher than homeowners have become used to over the last decade.
“The continued affordability squeeze will mean constrained market activity persists, and we expect house prices to continue to fall into next year.
“Based on our current economic assumptions, we anticipate that being a gradual rather than a precipitous decline.
“And one that is unlikely to fully reverse the house price growth recorded over recent years, with average property prices still some £45,000 (+19%) above pre-Covid levels.”
Nations and regions house prices:
Average house prices fell on an annual basis in almost all parts of the UK in July, with the only exception being the West Midlands (+0.0%, average house price of £250,285), where they remained effectively flat.
The South East remains the area where house prices are facing the most downward pressure. Down -3.9% on an annual basis, just over £15,500 has been taken off the value of a typical property in the region over the last year (average house price now £382,489).
Greater London mirrors that trend, with average property prices down by -3.5% annually in the capital (average house price now £531,141).
Wales – home to some of the most rapid growth in house prices witnessed during the pandemic ‘boom’ – experienced a -3.3% reduction on an annual basis (average house price now £214,495).
In Scotland, prices were down by less, at -0.7% over the last year (average house price of £201,501) while in Northern Ireland they were down by just -0.3% annually (average house price of £185,322).
UK house prices Historical data National: All Houses, All Buyers (Seasonally Adjusted):
|
Period |
Index Jan 1992=100 |
Standardised average price £ |
Monthly change % |
Quarterly change % |
Annual change % |
|
July 2022 |
503.5 |
292,009 |
-0.5 |
3.0 |
11.4 |
|
August |
507.0 |
293,992 |
0.7 |
2.3 |
11.4 |
|
September |
506.4 |
293,664 |
-0.1 |
1.2 |
9.8 |
|
October |
504.2 |
292,406 |
-0.4 |
0.6 |
8.2 |
|
November |
492.2 |
285,425 |
-2.4 |
-0.9 |
4.6 |
|
December |
485.8 |
281,713 |
-1.3 |
-2.3 |
2.1 |
|
January 2023 |
486.9 |
282,360 |
0.2 |
-3.5 |
2.1 |
|
February |
492.6 |
285,660 |
1.2 |
-2.5 |
2.1 |
|
March |
496.4 |
287,891 |
0.8 |
-0.4 |
1.6 |
|
April |
494.3 |
286,662 |
-0.4 |
1.3 |
0.1 |
|
May |
493.6 |
286,234 |
-0.2 |
1.3 |
-1.1 |
|
June |
493.2 |
286,011 |
-0.1 |
0.4 |
-2.6 |
|
July |
491.5 |
285,044 |
-0.3 |
-0.3 |
-2.4 |
Next publication:
The next Halifax House Price Index for July 2023 will be published at 07:00 on Thursday, 7 September 2023.
Kindly shared by Halifax
Main article photo courtesy of Pixabay


