Halifax HPI: House prices edge down as market cools amid higher interest rates
The Halifax HPI for June 2023 has been published, showing house prices edge down as market cools amid higher interest rates.
Key points from publication:
-
- Average house price fell by -0.1% in June, a third consecutive monthly decline
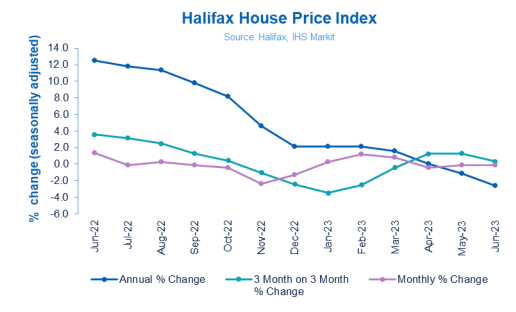
- Annual rate of house price growth fell to -2.6%, from -1.1% in May
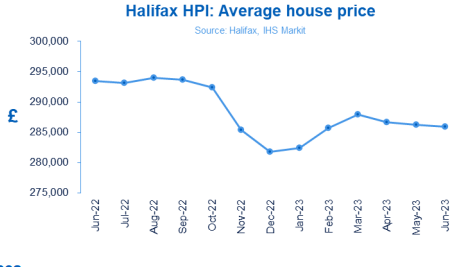
- Typical UK property now costs £285,932 (vs peak of £293,992 last August)
- New-build prices more resilient compared to existing homes
- Southern England sees most downward pressure on property prices
Key indicators:
|
Average house price |
Monthly change |
Quarterly change |
Annual change |
|
£285,932 |
-0.1% |
+0.3% |
-2.6% |

Kim Kinnaird, Director, Halifax Mortgages, said:
“The average UK house price fell slightly in June, down by around £300 compared to May (-0.1%) with a typical property now costing £285,932. This was the third consecutive monthly fall, albeit it a modest one.
“The annual drop of -2.6% (-£7,500) is the largest year-on-year decrease since June 2011. With very little movement in house prices over recent months, this rate of decline largely reflects the impact of historically high house prices last summer – annual growth peaked at +12.5% in June 2022 – supported by the temporary Stamp Duty cut.
“To some extent the annual growth figure also masks the fluctuations we’ve seen in the market over the past 12 months. Average house prices are actually up by +1.5% (£4,000) so far this year, with most of that growth coming in the first quarter, following the sharp fall in prices we saw at the end of last year in the aftermath of the mini-budget.
“These latest figures do suggest a degree of stability in the face of economic uncertainty, and the volume of mortgage applications held up well throughout June, particularly from first-time buyers.
“That said the housing market remains sensitive to volatility in borrowing costs. Concerns about persistent inflation have led to a significant increase in the cost of funding. Coupled with base rate rising by another 50bp, this contributed to a big jump in typical mortgage rates over the last month.
“The resulting squeeze on affordability will inevitably act as a brake on demand, as buyers consider what they can realistically afford to offer. While there’s always a lag effect when rates go up, many existing mortgage holders with variable deals or rolling off fixed rates will likely face an increase in the next year.
“The recently announced Mortgage Charter provides important reassurance that mortgage holders have a range of options if they’re concerned about making repayments, and that lenders will be flexible when supporting anyone in difficulty. Extended terms, affordable repayment plans and alternative fixed rate deals are among the choices for existing borrowers seeking to mitigate the impact of higher interest rates.
“How deep or persistent the downturn in house prices will be remains hard to predict. Consumer price inflation is likely to come down in the near term as energy and food prices look set to reverse their steep rises, but core inflation is clearly proving stickier than originally expected.
“With markets now forecasting a peak in Bank Rate of over 6%, the likelihood is that mortgage rates will remain higher for longer, and the squeeze on household finances will continue to put downward pressure on house prices over the coming year.”
Property types:
The latest figures suggest some resilience in new build property prices (up by +1.9%) annually. However, the rate of growth has continued to slow, and has now dropped to its lowest level in more than three years.
Existing properties, which were instrumental in driving prices up during the pandemic related housing rush, were down by -3.5% year-on-year in June. That was the steepest decline since August 2009.
Prices fell on an annual basis in June across all property types led by flats (-3.1%) and terraced homes (-2.5%). The declines for semi-detached and detached homes were -1.9% and -1.3% respectively.
Nations and regions house prices:
Average house prices are now falling on an annual basis in most parts of the UK, with the only exceptions being the West Midlands (+1.5%, average house price of £251,139), along with marginal gains in Yorkshire & Humberside (+0.2%, £203,674) and Northern Ireland (+0.2%, £186,856).
The South of England remains the area where house prices are facing the most downward pressure. At -3.0%, the annual fall in the South East was the largest since July 2011 (average house price now £384,106).
London recorded an annual decline of -2.6% (average property price of £533,057), its weakest performance since October 2009 and a drop of around £15,000 over the last year.
Welsh house prices were down by -1.8% annual (average house price of £215,183), compared to a +1.0% increase in May – the nation’s first year-on-year fall since March 2013.
In Scotland, prices were down slightly on the year (-0.1%, average house price of £201,774), but nonetheless significant in being the first annual contraction in property prices in the last three years.
Housing activity*:
-
- HMRC monthly property transaction data shows UK home sales decreased in May 2023. UK seasonally adjusted (SA) residential transactions in May 2023 totalled 80,020 – down by 2.7% from April’s figure of 82,220 (up 9.9% on a non-SA basis). Quarterly SA transactions (March 2023 – May 2023) were approximately 9.7% lower than the preceding three months (December 2022 – February 2023). Year-on-year SA transactions were 27.0% lower than May 2022 (25.5% lower on a non-SA basis). (Source: HMRC)
- Latest Bank of England figures show the number of mortgages approved to finance house purchases increased in May 2023, by 3.1% to 50,524. Year-on-year the May figure was 23.7% below May 2022. (Source: Bank of England, seasonally-adjusted figures)
- The RICS Residential Market Survey results for May 2023 were less downbeat with metrics on demand and sales the least negative in over a year and new instructions moving into net positive territory. New buyer enquiries returned a net balance of -18%, up from -34% in April, agreed sales -7% (up from -18% previously) and new instructions +14% (previously -2%). (Source: Royal Institution of Chartered Surveyors’ (RICS) monthly report)
* note all figures relate to May, so will not reflect the market impact of recent increases in average mortgage rates
UK house prices Historical data National: All Houses, All Buyers (Seasonally Adjusted):
|
Period |
Index Jan 1992=100 |
Standardised average price |
Monthly change % |
Quarterly change % |
Annual change % |
|
June 2023 |
506.1 |
293,507 |
1.4 |
3.6 |
12.5 |
|
July |
505.5 |
293,173 |
-0.1 |
3.1 |
11.8 |
|
August |
507.0 |
293,992 |
0.3 |
2.5 |
11.4 |
|
September |
506.4 |
293,664 |
-0.1 |
1.3 |
9.8 |
|
October |
504.2 |
292,406 |
-0.4 |
0.4 |
8.2 |
|
November |
492.2 |
285,425 |
-2.4 |
-1.0 |
4.6 |
|
December |
485.8 |
281,713 |
-1.3 |
-2.4 |
2.1 |
|
January 2023 |
486.9 |
282,360 |
0.2 |
-3.5 |
2.1 |
|
February |
492.6 |
285,660 |
1.2 |
-2.5 |
2.1 |
|
March |
496.4 |
287,891 |
0.8 |
-0.4 |
1.6 |
|
April |
494.3 |
286,662 |
-0.4 |
1.3 |
0.1 |
|
May |
493.6 |
286,234 |
-0.2 |
1.3 |
-1.1 |
|
June |
493.1 |
285,932 |
-0.1 |
0.3 |
-2.6 |
Next publication:
The next Halifax House Price Index for July 2023 will be published at 07:00 on Monday, 7 August 2023.
Kindly shared by Halifax
Main article photo courtesy of Pixabay


