


Halifax HPI for August 2024: UK house prices edge up to hit two-year high
The Halifax HPI for August 2024 has been published, with the data showing that UK house prices have edged up to hit two-year high.
Key pointers:
-
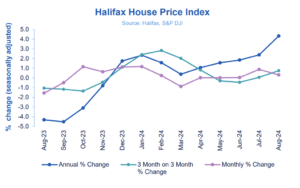
- House prices increased by +0.3% in August, after +0.9% rise in July
- Year-on-year prices are up +4.3%, the strongest rate since November 2022
- Higher annual growth largely reflects the base impact of weaker prices a year ago
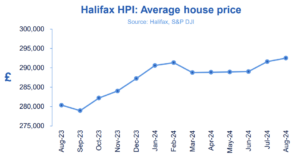
- Typical property now costs £292,505 (compared to £291,585 in July), highest since August 2022
- Northern Ireland continues to record the strongest annual house price growth in the UK
Key indicators:
|
Average house price |
Monthly change |
Quarterly change |
Annual change |
|
£292,505 |
+0.3% |
+0.8% |
+4.3% |
Amanda Bryden, Head of Mortgages, Halifax, said:
“House prices increased by +0.3% in August, following a rise of +0.9% in July, with the typical property now costing £292,505.
“Annual growth has risen to +4.3%, the strongest rate since November 2022, but this is due in large part to the comparison with weaker growth this time last year.
“Recent price rises build on a largely positive summer for the UK housing market. Prospective homebuyers are feeling more confident thanks to easing interest rates.
“That optimism is reflected in the latest mortgage approval figures, now at their highest level in almost two years.
“Such has been the resilience of house prices that the average property is now just £1,000 shy of the record high set in June 2022 (£293,507).
“While this is welcome news for existing homeowners, affordability remains a significant challenge for many potential buyers still adjusting to higher mortgage costs.
“However, with market activity picking up and the possibility of further interest rate reductions to come, we expect house prices to continue their modest growth through the remainder of this year.”
Nations and regions house prices:
Northern Ireland continues to record the strongest property price growth of any nation or region in the UK, rising by +9.8% on an annual basis in August. The average price of a property in Northern Ireland is now £201,043.
House prices in Wales also recorded strong growth, up +5.5%, compared to the previous year, with properties now costing an average of £224,433.
Scotland saw a more modest rise in house prices, where a typical property now costs £205,144, +1.7% more than the year before.
The North-West once again recorded the strongest house price growth of any region in England, up by +4.0% over the last year, to sit at £232,917.
London continues to have the most expensive property prices in the UK, now averaging £536,056, up +1.5% compared to last year.
Housing activity:
-
- HMRC monthly property transaction data shows UK home sales decreased in July 2024 compared to the previous month. UK seasonally adjusted (SA) residential transactions in July 2024 totalled 90,630 – down by – 0.6% from June’s figure of 91,220 (up +6.9% on a non-SA basis). Quarterly SA transactions (May 2024 – July 2024) were approximately +5.1% higher than the preceding three months (February 2023 – April 2024). Year-on-year SA transactions were +6.7% higher than July 2023 (+13.2% higher on a non-SA basis). (Source: HMRC)
- Latest Bank of England figures show the number of mortgages approved to finance house purchases increased slightly in July 2024, by +2.3% to 61,985. Year-on-year the figure was +26.5% above July 2023. (Source: Bank of England, seasonally-adjusted figures)
- The RICS Residential Market Survey results for July 2024 show a stable trend in market activity. New buyer enquiries has a net reading of +2%, up from -6%, with agreed sales also up to -2%, from -6%. New instructions are back in positive territory at +2%, from -9%. (Source: Royal Institution of Chartered Surveyors (RICS) monthly report)
UK house prices Historical data National: All Houses, All Buyers (Seasonally Adjusted):
|
Period |
Index Jan 1992=100 |
Standardised average Price £ |
Monthly change % |
Quarterly change % |
Annual change % |
|
August 2023 |
483.5 |
280,372 |
-1.6 |
-1.1 |
-4.3 |
|
September |
481.1 |
278,985 |
-0.5 |
-1.2 |
-4.5 |
|
October |
486.7 |
282,221 |
1.2 |
-1.3 |
-3.1 |
|
November |
489.8 |
284,039 |
0.6 |
-0.4 |
-0.8 |
|
December |
495.3 |
287,244 |
1.1 |
1.1 |
1.8 |
|
January 2024 |
501.1 |
290,608 |
1.2 |
2.4 |
2.3 |
|
February |
502.4 |
291,338 |
0.3 |
2.8 |
1.6 |
|
March |
498.0 |
288,781 |
-0.9 |
2.0 |
0.4 |
|
April |
498.1 |
288,862 |
0.0 |
0.8 |
1.1 |
|
May |
498.2 |
288,931 |
0.0 |
-0.3 |
1.6 |
|
June |
498.4 |
289,042 |
0.0 |
-0.4 |
1.9 |
|
July |
502.8 |
291,585 |
0.9 |
0.1 |
2.4 |
|
August |
504.4 |
292,505 |
0.3 |
0.8 |
2.3 |
Next publication:
The next Halifax House Price Index for September 2024 will be published at 07:00 on Monday, 7th October 2024.
Kindly shared by Halifax


