


HALIFAX House Price Index: May
UK house prices dip slightly in May, but market remains steady
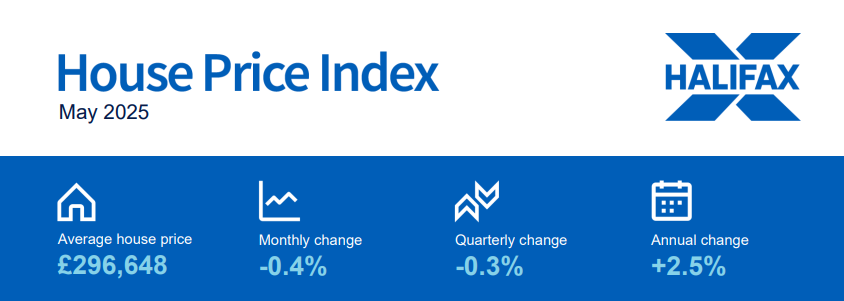
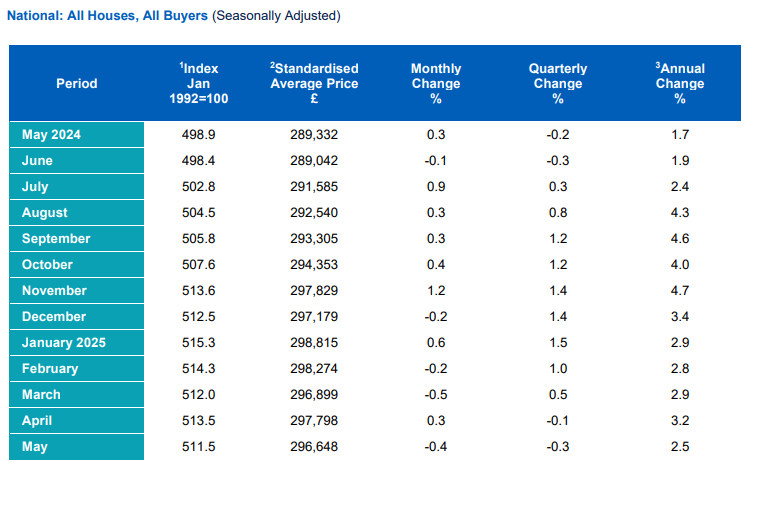
- House prices fell by -0.4% in May vs rise of +0.3% in April
- Average property price now £296,648 compared to £297,798 last month
- Annual rate of growth slows to +2.5% from +3.2% in April
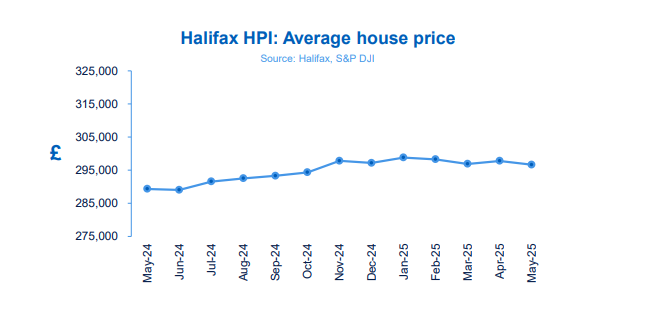
- Overall house prices have remained stable so far this year
- Northern Ireland continues to lead annual price growth in the UK
Amanda Bryden, Head of Mortgages, Halifax, said:
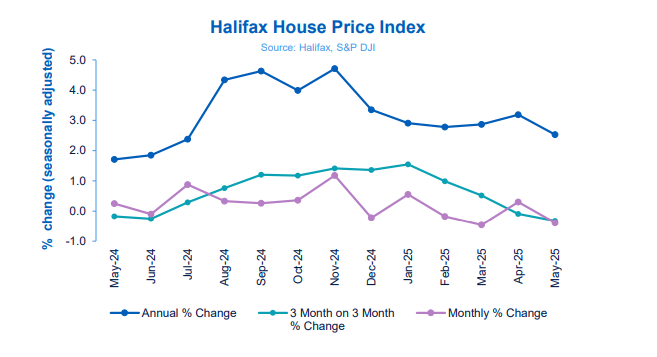
“Average UK house prices fell by -0.4% in May – a drop of around £1,150 – following a modest rise in April. Over the past 12 months, prices have grown by +2.5%, adding just over £7,000 to the value of a typical home, which now stands at £296,648. -1.0 0.0 1.0 2.0 3.0 4.0 5.0 May-24 Jun-24 Jul-24 Aug-24 Sep-24 Oct-24 Nov-24 Dec-24 Jan-25 Feb-25 Mar-25 Apr-25 May-2 % 5 change (seasonally adjusted) Halifax House Price Index Annual % Change 3 Month on 3 Month % Change Monthly % Change Source: Halifax, S&P DJI Average house price £296,648 Monthly change -0.4% Quarterly change -0.3% Annual change +2.5%
“These small monthly movements point to a housing market that has remained largely stable, with average prices down by just -0.2% since the start of the year. The market appears to have absorbed the temporary surge in activity over spring, which was driven by the changes to stamp duty.
“Affordability remains a challenge, with house prices still high relative to incomes. However, lower mortgage rates and steady wage growth have helped support buyer confidence. “
The outlook will depend on the pace of cuts to interest rates, as well as the strength of future income growth and broader inflation trends. Despite ongoing pressure on household finances and a stilluncertain economic backdrop, the housing market has shown resilience – a story we expect to continue in the months ahead.”
Nations and regions house prices
House price growth across Northern Ireland, Wales and Scotland continues to outpace English regions.
Northern Ireland once again recorded the fastest pace of annual property price inflation, up by +8.6% over the past year. The typical home now costs £209,388, though prices remain well below the UK average.
Wales and Scotland also posted strong annual growth of +4.8% in May. Average prices now stand at £230,405 and £214,864 respectively.
Among the English regions, the North West and Yorkshire and the Humber lead the way, both showing annual house price growth of +3.7%. Average property values in these areas are now £240,823 and £213,983 respectively.
In contrast, London continues to see more subdued growth, with prices rising by just +1.2% year-onyear. However, the capital remains by far the most expensive part of the UK housing market, with the average home now priced at £542,017.
Housing activity
- HMRC monthly property transaction data shows UK home sales decreased in April 2025. UK seasonally adjusted (SA) residential transactions in April 2025 totalled 64,680 – down by -63.5% from March’s figure of 177,440 (down -66.1% on a non-SA basis). Quarterly SA transactions (February 2025 – April 2025) were approximately +23.3% higher than the preceding three months (November 2024 – January 2025). Year-on-year SA transactions were -28.0% lower than April 2024 (-28.0% lower on a non-SA basis). (Source: HMRC)
- Latest Bank of England figures show the number of mortgages approved to finance house purchases decreased in April 2025, by -4.9% to 60,463. Year-on-year the figure was -2.1% below April 2024. (Source: Bank of England, seasonally-adjusted figures)
- The RICS Residential Market Survey results for April 2025 show a continued weakening in sales market activity. New buyer enquiries posted a net balance reading of -33%, from -32% with agreed sales at -31%, from – 17%. The new instructions net balance remained at +6% (Source: Royal Institution of Chartered Surveyors (RICS) monthly report)
Kindly shared by Halifax Picture courtesy of Adobe


