


Halifax HPI for July 2024: UK house prices rise in July
The Halifax HPI for July 2024 has been published, with the data showing that UK house prices have risen in the month.
Key pointers:
-
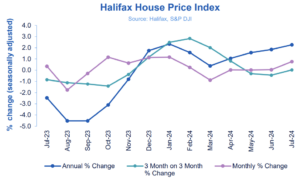
- House prices increased by +0.8% in July, following three relatively flat months
- Annual growth rate of +2.3% is the highest since January 2024
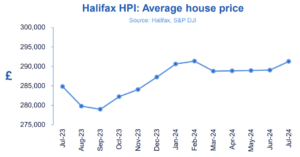
- Typical property now costs £291,268 (compared to £289,042 in June)
- Northern Ireland continues to record the strongest annual house price growth in the UK
Key indicators:
|
Average house price |
Monthly change |
Quarterly change |
Annual change |
|
£291,268 |
+0.8% |
+0.0% |
+2.3% |
Amanda Bryden, Head of Mortgages, Halifax, said:
“In July, UK house prices increased by +0.8% on a monthly basis, following three relatively flat months.
“The average house price in the UK is £291,268, up over £2,200 compared to the previous month.
“Annual growth rose to +2.3%, the highest rate since the start of this year.
“Last week’s Bank of England’s Base Rate cut, which follows recent reductions in mortgage rates, is encouraging for those looking to remortgage, purchase a first home or move along the housing ladder.
“However, affordability constraints and the lack of available properties continue to pose challenges for prospective homeowners.
“Against the backdrop of lower mortgage rates and potential further Base Rate reductions, we anticipate house prices to continue a modest upward trend throughout the remainder of this year.”
Nations and regions house prices:
Northern Ireland continues to record the strongest property price growth of any nation or region in the UK, rising by +5.8% on an annual basis in July, up from +4.1% the previous month and the highest increase since February 2023. The average price of a property in Northern Ireland is now £195,681.
House prices in the North-West also recorded strong growth, up +4.1%, compared to the previous month, properties here now average £232,489. In Wales, house prices grew +3.4% to £221,102 – the highest price seen since October 2022.
Scotland saw a rise in house prices, a typical property now costs £205,264, +2.1% more than the year before.
The only region or nation to record a fall across the UK was Eastern England. Properties here now average £330,282, down -0.4% on an annual basis.
London continues to have the most expensive property prices in the UK, now averaging £536,052, up (+1.2%) compared to last year.
Housing activity:
-
- HMRC monthly property transaction data shows UK home sales decreased in June 2024 compared to the previous month. UK seasonally adjusted (SA) residential transactions in June 2024 totalled 91,370 – down by – 0.6% from May’s figure of 91,880 (down -2.3% on a non-SA basis). Quarterly SA transactions (April 2024 – June 2024) were approximately +7.3% higher than the preceding three months (January 2023 – March 2024). Year-on-year SA transactions were +7.6% higher than June 2023 (+5.8% higher on a non-SA basis). (Source: HMRC)
- Latest Bank of England figures show the number of mortgages approved to finance house purchases decreased slightly in June 2024, by -0.3% to 59,976. Year-on-year the figure was +11.7% above June 2023. (Source: Bank of England, seasonally-adjusted figures)
- The RICS Residential Market Survey results for June 2024 point to a relatively subdued market. New buyer enquiries has a net reading of -7%, up slightly from -8%, with agreed sales also on -7%, up from -13%. New instructions slip into negative territory with a fall to -9%, bringing an end to its six consecutive positive monthly readings (down from +13%). (Source: Royal Institution of Chartered Surveyors (RICS) monthly report)
UK house prices Historical data National: All Houses, All Buyers (Seasonally Adjusted):
|
Period |
Index Jan 1992=100 |
Standardised average price £ |
Monthly change % |
Quarterly change % |
Annual change % |
|
July 2023 |
491.1 |
284,805 |
0.4 |
-0.8 |
-2.5 |
|
August |
482.5 |
279,793 |
-1.8 |
-1.1 |
-4.5 |
|
September |
481.1 |
278,985 |
-0.3 |
-1.2 |
-4.5 |
|
October |
486.7 |
282,221 |
1.2 |
-1.4 |
-3.1 |
|
November |
489.8 |
284,039 |
0.6 |
-0.4 |
-0.8 |
|
December |
495.3 |
287,244 |
1.1 |
1.2 |
1.8 |
|
January 2024 |
501.1 |
290,608 |
1.2 |
2.5 |
2.3 |
|
February |
502.4 |
291,338 |
0.3 |
2. 8 |
1.6 |
|
March |
498.0 |
288,781 |
-0.9 |
2.0 |
0.4 |
|
April |
498.1 |
288,862 |
0.0 |
0.8 |
1.1 |
|
May |
498.2 |
288,931 |
0.0 |
-0.3 |
1.6 |
|
June |
498.4 |
289,042 |
0.0 |
-0.4 |
1.9 |
|
July |
502.3 |
291,268 |
0.8 |
0.0 |
2.3 |
Next publication:
The next Halifax House Price Index for August 2024 will be published at 07:00 on Friday, 6 September 2024.
Kindly shared by Halifax


