


Halifax HPI: UK house prices static in May
The Halifax HPI for May 2024 has been published, showing that UK house prices been held at a static position for the month.
Key points from publication:
-
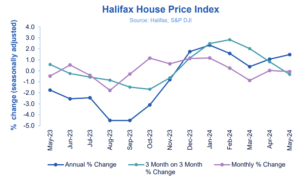
- Average house prices stable in May, down just -0.1% a monthly basis
- Annual rate of house price growth up +1.5% last month, from +1.1% in April
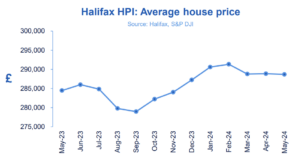
- Typical UK home now costs £288,688 (compared to £288,862 in April)
- The North-West has the strongest price growth of nation or region in the UK
Key indicators:
|
Average house price |
Monthly change |
Quarterly change |
Annual change |
|
£288,688 |
-0.1% |
-0.3% |
+1.5% |
Amanda Bryden, Head of Mortgages, Halifax, said:
“UK house prices were largely static in May, edging down slightly by -0.1% or around £170 in cash terms.
“On an annual basis house prices rose for a sixth consecutive month, up by +1.5% vs +1.1% in April. The average property price now stands at £288,688.
“Market activity remained resilient throughout the spring months, supported by strong nominal wage growth and some evidence of an improvement in confidence about the economic outlook.
“This has been reflected in a broadly stable picture in terms of property price movements, with the average cost of a property little changed over the last three months.
“A period of relative stability in both house prices and interest rates should give a degree of confidence to both buyers and sellers.
“While homebuyers and those remortgaging will continue to respond to changes in borrowing costs, set against a backdrop of a limited supply of available properties, the market is unlikely to see huge fluctuations in the near term.”
Nations and regions house prices:
The North-West is the strongest performing nation or region in the UK, where house prices grew +3.8% on an annual basis in May. The average price of a property in the North-West is now £232,258.
Northern Ireland continues to show strong growth, up +3.2% in May, pulling back slightly from +3.3% in April.
House prices in Scotland also increased, with a typical property now costing £204,952, +1.9% more than the year before.
In Wales, house prices grew annually by +0.7% to £219,483 (vs +1.1% in April).
Eastern England recorded the largest decline in annual growth across the UK. House prices here now average £329,853, down -0.8% in May.
Unsurprisingly, London continues to have the most expensive average price tag, now at £536,821, up marginally (+0.2%) compared to last year.
Housing activity:
-
- HMRC monthly property transaction data shows UK home sales increased in April 2024 compared to last month. UK seasonally adjusted (SA) residential transactions in April 2024 totalled 90,430 – up by 4.6% from March’s figure of 86,420 (down 8.6% on a non-SA basis). Quarterly SA transactions (February 2024 – April 2024) were approximately 5.9% higher than the preceding three months (November 2023 – January 2024). Year-on[1]year SA transactions were 9.8% higher than April 2023 (17.3% higher on a non-SA basis). (Source: HMRC)
- Latest Bank of England figures show the number of mortgages approved to finance house purchases decreased slightly in April 2024, by 0.2% to 61,140. Year-on-year the April figure was 25.8% above April 2023. (Source: Bank of England, seasonally-adjusted figures)
- The RICS Residential Market Survey results for April 2024 show a continued increase in new listings with average stock levels at a three year high of 43 properties per branch. New instructions reported a fifth consecutive net balance positive reading of +25% (from +13%), its highest score since October 2020. New buyer enquiries have however stalled, with a net balance reading of -1% (down from +6% last month), with agreed sales moving back into positive territory with a net balance of +5% (from -5%). (Source: Royal Institution of Chartered Surveyors (RICS) monthly report)
UK house prices – Historical data National: All Houses, All Buyers (Seasonally Adjusted):
|
Period |
Index Jan 1992=100 |
Standardised average price £ |
Monthly change % |
Quarterly change % |
Annual change % |
|
May 2023 |
490.6 |
284,477 |
-0.5 |
0.6 |
-1.8 |
|
June |
493.2 |
286,011 |
0.5 |
-0.2 |
-2.6 |
|
July |
491.2 |
284,852 |
-0.4 |
-0.6 |
-2.5 |
|
August |
482.5 |
279,793 |
-1.8 |
-0.9 |
-4.5 |
|
September |
481.1 |
278,985 |
-0.3 |
-1.5 |
-4.5 |
|
October |
486.7 |
282,221 |
1.2 |
-1.7 |
-3.1 |
|
November |
489.8 |
284,039 |
0.6 |
-0.6 |
-0.8 |
|
December |
495.3 |
287,244 |
1.1 |
1.2 |
1.8 |
|
January 2024 |
501.1 |
290,608 |
1.2 |
2.5 |
2.3 |
|
February |
502.4 |
291,338 |
0.3 |
2.8 |
1.6 |
|
March |
498.0 |
288,781 |
-0.9 |
2.0 |
0.4 |
|
April |
498.1 |
288,862 |
0.0 |
0.8 |
1.1 |
|
May |
497.8 |
288,688 |
-0.1 |
-0.3 |
1.5 |
Next publication:
The next Halifax House Price Index for June 2024 will be published at 07:00 on Friday, 5 July 2024.
Kindly shared by Halifax


