Halifax HPI: UK house prices fell in August as impact of higher rates flows through
The Halifax HPI for August 2023 has been published, showing UK house prices fell in August as impact of higher rates flows through.
Key points:
-
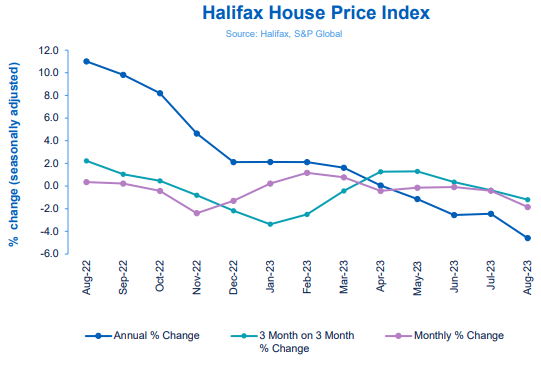
- Average house price fell by -1.9% in August, the largest monthly fall since November 2022
- Property prices dropped by -4.6% on an annual basis, from -2.5% in July, though prices were at a record peak last summer
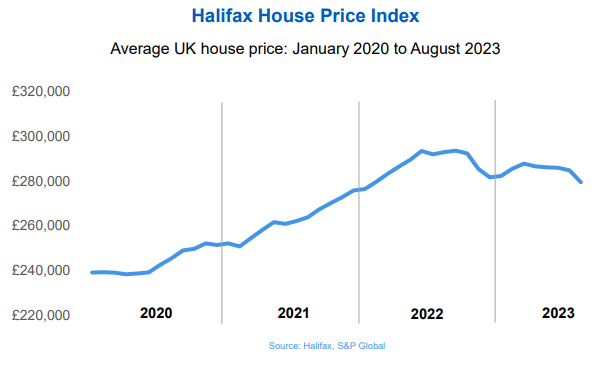
- Typical UK home now costs £279,569, down by around £14,000 over the last year, back to the level seen in early 2022
- Average prices remain around £40,000 above pre-pandemic levels
- Southern England and Wales seeing most downward pressure on property prices, Scotland showing greater resilience
Key indicators:
|
Average house price |
Monthly change |
Quarterly change |
Annual change |
|
£279,569 |
-1.9% |
-1.2% |
-4.6% |

Kim Kinnaird, Director, Halifax Mortgages, said:
“UK house prices fell again in August, with the monthly drop of -1.9% the steepest since last November, following a period of relative stability.
“The average home now costs £279,569, down by around £5,000 since July, and back to the level seen at the start of last year.
“On an annual basis prices fell by -4.6%, the biggest year-on-year decrease since 2009, though it should be noted that this is relative to the record-high property prices seen last summer.
“It’s fair to say that house prices have proven more resilient than expected so far this year, despite higher interest rates weighing on buyer demand.
“However, there is always a lag-effect where rate increases are concerned, and we may now be seeing a greater impact from higher mortgage costs flowing through to house prices.
“Increased volatility month-to-month is also to be expected when activity levels are lower, though overall the pace of decline remains in line with our outlook for the year as a whole.
“Market activity levels slowed during August, and while there is always a seasonality effect at this time of year, it also isn’t surprising given the pace of mortgage rate increases over June and July.
“While these did ease last month, rates remain much higher compared to recent years.
“This may well have prompted prospective buyers to defer transactions in the hope of some stability, and greater clarity on the future direction of rates in the coming months.
“The market will continue to rebalance until it finds an equilibrium where buyers are comfortable with mortgage costs in a higher range than seen over the previous 15 years.
“We do expect further downward pressure on property prices through to the end of this year and into next, in line with previous forecasts.
“While any drop won’t be welcomed by current homeowners, it’s important to remember that prices remain some £40,000 (+17%) above pre-pandemic levels.
“It may also come as some relief to those looking to get onto the property ladder.
“Income growth has remained strong over recent months, which has seen the house price to income ratio for first-time buyers fall from a peak of 5.8 in June last year to now 5.1.
“This is the most affordable level since June 2020, and will be partially offsetting the impact of higher mortgage costs.”
Nations and regions house prices:
All UK nations and the nine English regions registered a decline in house prices over the last year, with northern locations generally proving to be more resilient than areas in the south.
Buyers faced with the need to find larger deposits and fund bigger monthly repayments means the South East is experiencing the biggest drop. House prices have fallen by -5.0% on an annual basis (average house price of £379,565).
Wales, which recorded some of the biggest gains in property prices during the pandemic-driven race for space, has seen property prices fall by -4.7% over the last year (average house price of £212,967).
In Northern Ireland property prices have fallen by -1.5% annually (average house price of £182,700). In Scotland property prices fell by just -0.6% over the last year, the slowest pace of decline in the UK (average house price of £201,932).
London remains the most expensive place in the UK to purchase a home, with an average property price of £529,814. However with prices down by -4.1% over the last year, it has seen the biggest fall of any region in cash terms (-£22,777).
Housing activity:
-
- HMRC monthly property transaction data shows UK home sales increased slightly in July 2023. UK seasonally adjusted (SA) residential transactions in July 2023 totalled 86,510 – up by 0.8% from June’s figure of 85,820 (down 8.9% on a non-SA basis). Quarterly SA transactions (May 2023 – July 2023) were approximately 3.3% lower than the preceding three months (February 2023 – April 2023). Year-on-year SA transactions were 16.3% lower than July 2022 (21.7% lower on a non-SA basis). (Source: HMRC)
- Latest Bank of England figures show the number of mortgages approved to finance house purchases decreased in July 2023, by 9.5% to 49,444. Year-on-year the July figure was 21.7% below July 2022. (Source: Bank of England, seasonally-adjusted figures)
- The RICS Residential Market Survey results for July 2023 show key metrics continuing to decline. New buyer enquiries returned a net balance of -45%, up slightly from -46% in June, agreed sales -44% (down from -36% previously) and new instructions -15% (previously -3%). (Source: Royal Institution of Chartered Surveyors’ (RICS) monthly report)
UK house prices Historical data National: All Houses, All Buyers (Seasonally Adjusted):
|
Period |
Index Jan 1992=100 |
Standardised average price £ |
Monthly change % |
Quarterly change % |
Annual change % |
|
August 2022 |
505.3 |
293,025 |
0.4 |
2.2 |
11.0 |
|
September |
506.4 |
293,664 |
0.2 |
1.0 |
9.8 |
|
October |
504.2 |
292,406 |
-0.4 |
0.5 |
8.2 |
|
November |
492.2 |
285,425 |
-2.4 |
-0.8 |
4.6 |
|
December |
485.8 |
281,713 |
-1.3 |
-2.2 |
2.1 |
|
January 2023 |
486.9 |
282,360 |
0.2 |
-3.4 |
2.1 |
|
February |
492.6 |
285,660 |
1.2 |
-2.5 |
2.1 |
|
March |
496.4 |
287,891 |
0.8 |
-0.4 |
1.6 |
|
April |
494.3 |
286,662 |
-0.4 |
1.3 |
0.1 |
|
May |
493.6 |
286,234 |
-0.2 |
1.3 |
-1.1 |
|
June |
493.2 |
286,011 |
-0.1 |
0.4 |
-2.6 |
|
July |
491.2 |
284,852 |
-0.4 |
-0.4 |
-2.5 |
|
August |
482.1 |
279,569 |
-1.9 |
-1.2 |
-4.6 |
Next publication:
The next Halifax House Price Index for September 2023 will be published at 07:00 on Friday, 6 October 2023.
Kindly shared by Halifax
Main article photo courtesy of Pixabay


