


ONS publishes its UK House Price Index for May 2023
The Office for National Statistics (ONS) publishes its UK House Price Index for May 2023, showing monthly house price inflation in the UK.
Main points:
-
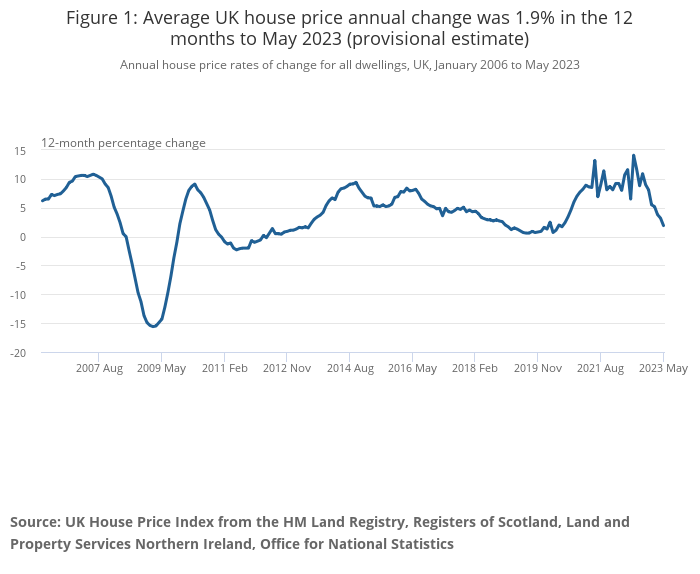
- Average UK house prices increased by 1.9% in the 12 months to May 2023 (provisional estimate), down from a revised 3.2% in April 2023.
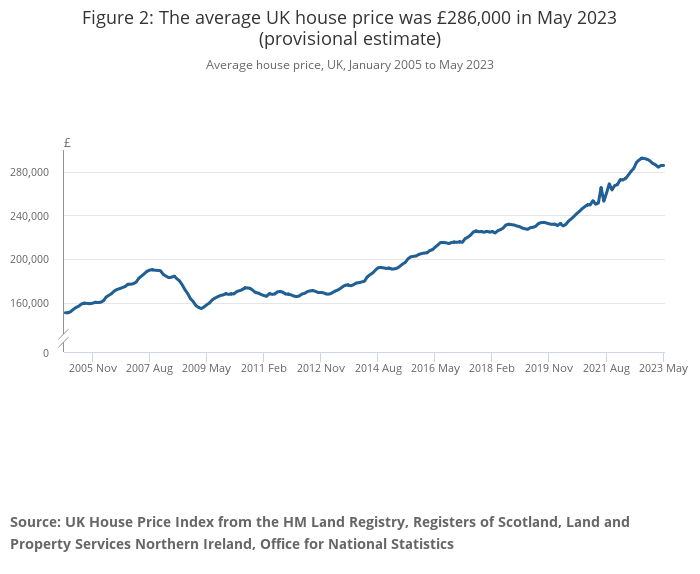
- The average UK house price was £286,000 in May 2023, which is £6,000 higher than 12 months ago, but £7,000 below the recent peak in September 2022.
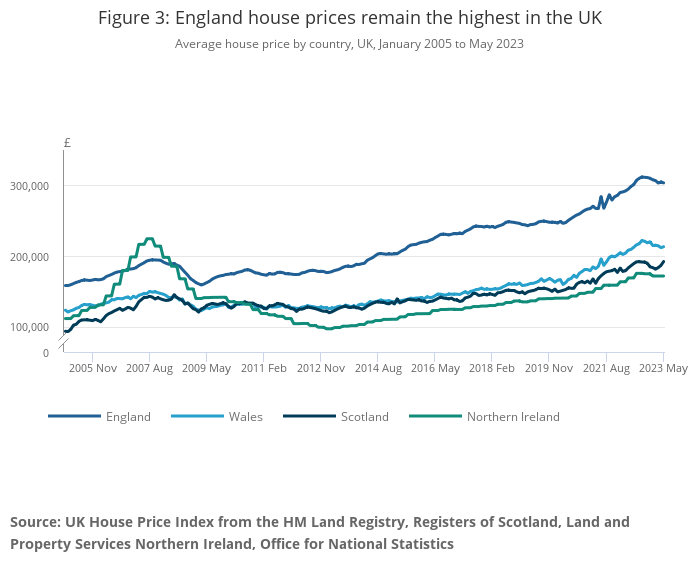
- Average house prices increased over the 12 months to May 2023, to £304,000 in England (1.7%), £213,000 in Wales (1.8%), £193,000 in Scotland (3.2%) and £172,000 in Northern Ireland (5.0%).
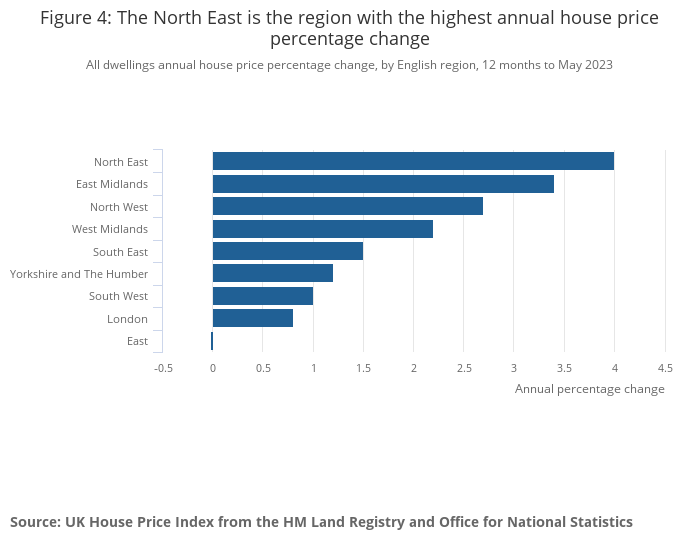
- The North East saw the highest annual percentage change of all English regions in the 12 months to May 2023 (4.0%), while the East saw the lowest (0.0%).
UK house prices:
The latest house price data published on GOV.UK by HM Land Registry (HMLR) for May 2023 show that the provisional estimate for average UK house price annual inflation was 1.9% in the 12 months to May 2023. This was down from the revised estimate of 3.2% in the 12 months to April 2023, and the recent peak in annual inflation of 14.1% in July 2022. The provisional estimate for average UK house price was £286,000 in May 2023, which is £6,000 higher than 12 months ago, but £7,000 below the recent peak in September 2022.
These estimates are provisional and are subject to revision. All statistics are non-seasonally adjusted estimates, unless explicitly stated otherwise.
The coronavirus (COVID-19) pandemic affected the supply of housing transactions for a period of time. Further information can be found in Section 7: Measuring the data.
Notes:
1. Not seasonally adjusted.
2. HMLR’s UK House Price Index (HPI) release on GOV.UK is available to download.
3. Volatility in 2021 and 2022 reflects house price movements around changes in Stamp Duty Land Tax in 2021.
The provisional seasonally-adjusted estimate for UK residential transactions in May 2023 was 80,020, reported in HM Revenue and Customs’ (HMRC’s) Monthly property transactions statistics. This provisional estimate for May 2023 is 27% lower than the revised estimate for May 2022 and 3% lower than the provisional estimate for April 2023.
Notes:
1. Not seasonally adjusted.
2. HMLR’s UK House Price Index (HPI) release on GOV.UK is available to download.
On a seasonally-adjusted basis, the average UK house price decreased by 0.4% in May 2023, following a month-on-month increase of 0.5% in April 2023.
On a non-seasonally adjusted basis, the average UK house price remained little changed in May 2023, following a month-on-month increase of 0.6% in April 2023.
House prices by country:
Notes:
1. Not seasonally adjusted.
2. The HMLR’s UK House Price Index (HPI) release on GOV.UK is available to download.
3. Northern Ireland (NI) data are only available on a quarterly basis; Northern Ireland data will be copied forward until next quarter’s data are available, which will be in the June 2023 bulletin released 16 August 2023.
4. View further information on Northern Ireland HPI publications and future release schedules can be viewed.
The average house price in England increased by 1.7% over the 12 months to May 2023, down from an increase of 3.4% in the 12 months to April 2023. The average house price in England was £304,000 in May 2023.
The average house price in Scotland increased by 3.2% over the 12 months to May 2023, up from an increase of 1.8% in the 12 months to April 2023. The average house price in Scotland was £193,000 in May 2023.
The average house price in Wales increased by 1.8% over the 12 months to May 2023, up from an increase of 1.7% in the 12 months to April 2023. The average house price in Wales was £213,000 in May 2023.
The average house price in Northern Ireland increased by 5.0% over the year to Quarter 1 (Jan to Mar) 2023. Northern Ireland remains the cheapest country in the UK in which to purchase a property, with the average house price at £172,000.
House prices by region in England:
Notes:
1. Not seasonally adjusted.
2. HMLR’s UK House Price Index (HPI) release on GOV.UK is available to download.
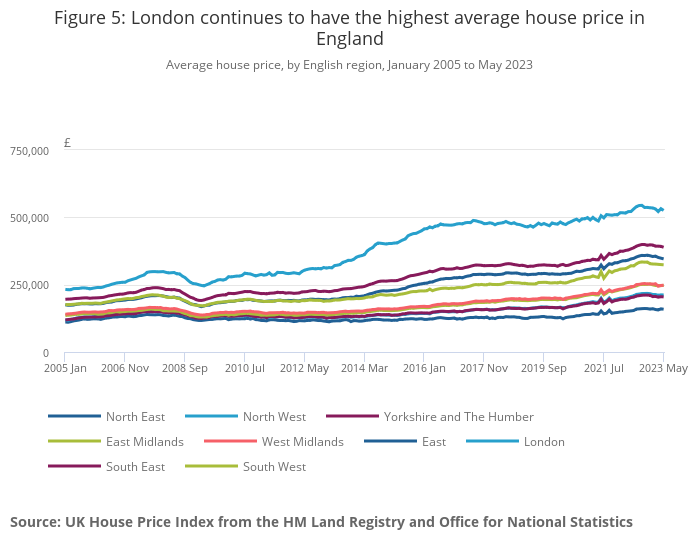
The North East continued to have the lowest average house price of all English regions, at £159,000 in May 2023.
The North East is also the region with the highest annual house price inflation, with average prices increasing by 4.0% in the 12 months to May 2023, down from an annual percentage change of 5.7% in April 2023.
London’s average house prices remain the most expensive of any region in the UK, with an average price of £526,000 in May 2023.
The East of England was the English region with the lowest annual house price inflation, with average prices little changed (0.0%) in the 12 months to May 2023, following an annual percentage increase of 2.1% in the 12 months to April 2023.
Notes:
1. Data at the local authority level and other breakdowns can be found in the HMLR’s UK House Price Index (HPI) release on GOV.UK.
House Price Index data:
-
- UK House Price Index
Dataset | Released 19 July 2023
Monthly house price movements, including average price by property type, sales and cash mortgage sales, as well as information on first-time buyers, new builds and former owner occupiers. Data are collected by HM Land Registry and published on GOV.UK. - UK house price data: quarterly tables
Dataset | Released 24 May 2023
Quarterly house price data based on a sub-sample of the Regulated Mortgage Survey. - House Price Index: annual tables 20 to 38
Dataset | Released 19 July 2023
Annual house price data based on a sub-sample of the Regulated Mortgage Survey.
- UK House Price Index
Kindly shared by Office for National Statistics (ONS)
Main article photo courtesy of Pixabay


