Halifax HPI: UK house prices dipped in April, but market is more stable
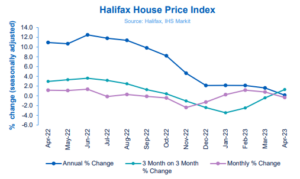
Halifax have published their House Price Index for April 2023, showing UK house prices dipped in April, but the market is more stable.
Key points from publication:
-
- Average house price decreased by -0.3% in April (following +0.8% rise in March)
- Annual rate of house price growth slowed to +0.1% (vs +1.6% in March)
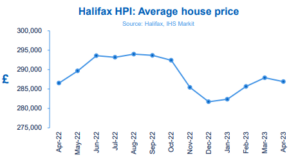
- Typical UK property now costs £286,896 (compared to £287,891 in March)
- First-time buyer market remains resilient in the face of rising rental costs
- House prices in the south of England under the greatest pressure
Key indicators:
|
Average house price |
Monthly change |
Quarterly change |
Annual change |
|
£286,896 |
-0.3% |
+1.3% |
+0.1% |
Kim Kinnaird, Director, Halifax Mortgages, said:
“After three consecutive months of growth, the average UK house price fell in April, down by -0.3% or around £1,000 over the month.
“The rate of annual house price inflation also slowed further to +0.1%, from +1.6% in March, meaning average property prices are largely unchanged from this time last year. A typical property now costs £286,896, which is around £7,000 below last summer’s peak, though still some £28,000 higher than two years ago.
“House price movements over recent months have largely mirrored the short-term volatility seen in borrowing costs.
“The sharp fall in prices we saw at the end of last year after September’s ‘mini-budget’ preceded something of a rebound in the first quarter of this year as economic conditions improved.
“The economy has proven to be resilient, with a robust labour market and consumer price inflation predicted to decelerate sharply in the coming months.
“Mortgage rates are now stabilising, and though they remain well above the average of recent years, this gives important certainty to would-be buyers. While the housing market as a whole remains subdued, the number of properties for sale is also slowly increasing, as sellers adapt to market conditions.
“Alongside a market-wide uptick in mortgage approvals, these latest figures may indicate a more steady environment.
“However, cost of living concerns remain real for many households, which will likely continue weigh on sentiment and activity.
“Combined with the impact of higher interest rates gradually feeding through to those re-mortgaging their current fixed-rate deals, we should expect some further downward pressure on house prices over course of this year.”
Property and buyer types:
Existing property prices have fallen by -0.6% over the last year. In contrast new-build house prices continue to provide some support to the wider market, rising by +3.5% year-on-year.
The first-time buyer market is also proving to be more resilient, with average property prices up +0.7% over the last year, compared to a fall of -0.1% for home movers. One factor behind this difference may be that with rents continuing to rise sharply, it’s becoming increasingly cost effective to purchase a home, despite the challenge of raising a deposit and higher mortgage borrowing costs.
Nations and regions house prices:
There’s an increasingly mixed picture emerging for house prices across the UK. The four regions of southern England have seen average house prices fall over the last year, with the South East registering the largest dip (- 0.6%, average house price of £387,469).
Typically, it’s these regions (including Greater London, Eastern England and the South West) where buyers face the most expensive average property prices, and therefore the biggest impact of higher borrowing costs. London continues to have the costliest homes of anywhere in the country at an average of £538,409 (annual rate of growth now -0.2%).
Elsewhere all other regions and nations across the UK saw the rate of annual property price inflation remain in positive territory during April. The West Midlands posted the strongest annual growth of +3.1% (average property price of £249,554).
Northern Ireland (+2.7%, £186,846), Scotland (+2.2%, £201,489) and Wales (+1.0%, £216,559) have also seen average property prices increase year-on-year.
Housing activity:
-
- HMRC monthly property transaction data shows UK home sales increased in March 2023. UK seasonally adjusted (SA) residential transactions in March 2023 totalled 89,560 – up by 1.3% from February’s figure of 88,380 (up 26.2% on a non-SA basis). Quarterly SA transactions (January 2023-March 2023) were approximately 10.2% lower than the preceding three months (October 2022 – December 2022). Year-on-year SA transactions were 18.9% lower than March 2022 (13.6% lower on a non-SA basis). (Source: HMRC)
- Latest Bank of England figures show the number of mortgages approved to finance house purchases increased in March 2023, by 17.9% to 52,011. Year-on-year the March figure was 25.5% below March 2022. (Source: Bank of England, seasonally-adjusted figures)
- The March 2023 RICS Residential Market Survey results continue to show a subdued market. New buyer enquiries returned a net balance of -29%, up from -30% previously. Agreed sales had a net balance of -31% (-25% previously) and new instructions returned a net balance of -6% (previously -4%). (Source: Royal Institution of Chartered Surveyors’ (RICS) monthly report)
UK house prices Historical data National: All Houses, All Buyers (Seasonally Adjusted):
|
Period |
Index Jan 1992=100 |
Standardised average price £ |
Monthly change % |
Quarterly change % |
Annual change % |
|
April 2022 |
494.1 |
286,523 |
1.1 |
3.0 |
10.9 |
|
May |
499.5 |
289,666 |
1.1 |
3.3 |
10.7 |
|
June |
506.3 |
293,586 |
1.4 |
3.6 |
12.5 |
|
July |
505.5 |
293,173 |
-0.1 |
3.2 |
11.8 |
|
August |
507.0 |
293,992 |
0.3 |
2.5 |
11.4 |
|
September |
506.4 |
293,664 |
-0.1 |
1.3 |
9.8 |
|
October |
504.2 |
292,406 |
-0.4 |
0.4 |
8.2 |
|
November |
492.2 |
285,425 |
-2.4 |
-1.1 |
4.6 |
|
December |
485.8 |
281,713 |
-1.3 |
-2.4 |
2.1 |
|
January 2023 |
486.9 |
282,360 |
0.2 |
-3.5 |
2.1 |
|
February |
492.6 |
285,660 |
1.2 |
-2.5 |
2.1 |
|
March |
496.4 |
287,891 |
0.8 |
-0.4 |
1.6 |
|
April |
494.7 |
286,896 |
-0.3 |
1.3 |
0.1 |
Next publication:
The next Halifax House Price Index for May 2023 will be published at 07:00 on Wednesday 7 June 2023.
Kindly shared by Halifax
Main article photo courtesy of Pixabay


