Annual house price growth unchanged for third consecutive month – Halifax House Price Index
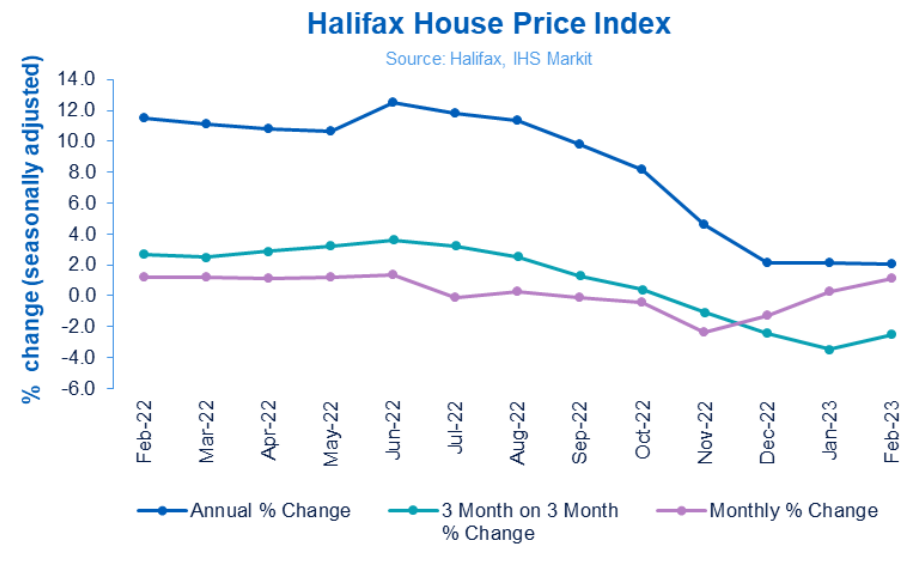
Annual house price growth unchanged for third consecutive month, according to the publication of the February Halifax House Price Index.
Key points from publication:
-
- Annual rate of house price growth remains at +2.1% for third consecutive month
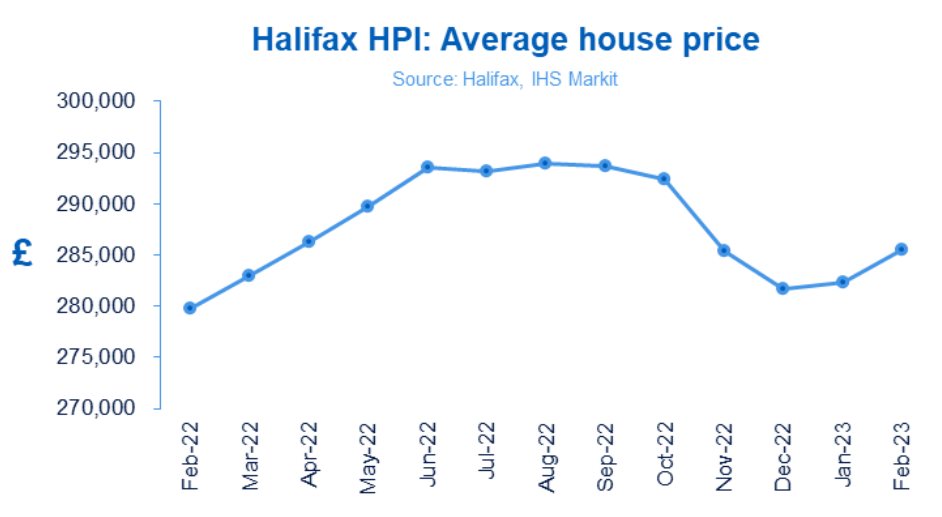
- Typical UK property now costs £285,476 (compared to £282,360 last month)
- Monthly change 1.1% from 0.2% in January and -1.3% December
- Rate of annual growth slowed in all nations and regions during February
Key metrics:
|
Average house price |
Monthly change |
Quarterly change |
Annual change |
|
£285,476 |
+1.1% |
-2.5% |
+2.1% |

Kim Kinnaird, Director, Halifax Mortgages, said:
“The average house price in February was £285,476, 2.1% up on this time last year, and has been stable over the last three months.
“Average house price £285,476 Monthly change 1.1% Quarterly change -2.5% Annual change +2.1%
“When comparing to January, there was a 1.1% increase in house prices through the month of February, although overall prices are flat compared to three months ago.
“Recent reductions in mortgage rates, improving consumer confidence, and a continuing resilience in the labour market are arguably helping to stabilise prices following the falls seen in November and December.
“Still, with the cost of a home down on a quarterly basis, the underlying activity continues to indicate a general downward trend.
“In cash terms, house prices are down around £8,500 (-2.9%) on the August 2022 peak but remain almost £9,000 above the average prices seen at the start of 2022 and are still above pre-pandemic levels, meaning most sellers will retain price gains made during the pandemic.
“With average house prices remaining high housing affordability will continue to feel challenging for many buyers.”
Nations and regions house prices:
The rate of annual growth slowed in all nations and regions in February.
Annual growth reduced most significantly in the North East, at 1.1% in February vs a rise of 3.6% in January, with homes now costing an average £163,953.
Average house prices in London are now £526,842, a 0.9% fall from January’s £530,416. London may be affected by its large proportion of flats – prices for which have broadly stagnated. Despite this slowdown, homes in London still cost over £240,000 more than the UK national average.
Annual growth fell the least in Scotland. House prices in the nation are now an average £198,779 (a growth rate of 2.2%, vs 2.3% in January.)
Similarly in Wales, annual growth in February was 1.2% (vs 1.9% in January), with homes costing £210,917, on average.
Those purchasing a home in Northern Ireland will now pay £185,009, on average, an annual growth rate of 5.7% (vs 7.0% in January.)
Property types:
By property type, prices of flats are now into negative territory over the past 12 months (-0.3% annual growth), while prices for terraced properties have broadly stagnated (+0.3%). For detached properties, these have increased by just +1.5% on the year, the lowest rise since the end of 2019.
Annual price inflation remains stronger for new houses (+6.6%, a four-month high) than for existing properties (+1.1%, unchanged at the lowest in nearly a decade).
Housing activity:
-
- HMRC monthly property transaction data shows UK home sales decreased in January 2023. UK seasonally adjusted (SA) residential transactions in January 2023 were 96,650 – down by 2.6% from December’s figure of 99,260 (down 27.5% on a non-SA basis). Quarterly SA transactions (November 2022-January 2023) were approximately 4.0% lower than the preceding three months (August 2022 – October 2022). Year-on-year SA transactions were 10.6% lower than January 2022 (7.5% lower on a non-SA basis). (Source: HMRC)
- Latest Bank of England figures show the number of mortgages approved to finance house purchases decreased in January 2023, by 2.2% to 39,637. Year-on-year the January figure was 46% below January 2022. (Source: Bank of England, seasonally-adjusted figures)
- The January 2023 RICS Residential Market Survey results show metrics on buyer enquiries, agreed sales and new instructions remain negative. The reading for new buyer enquiries slipped to a net balance of -47%, down from -40% previously. Agreed sales had a net balance of -39% (-41% previously) and new instructions returned a net balance of -14% (previously -23%). (Source: Royal Institution of Chartered Surveyors’ (RICS) monthly report)
UK house prices (Historical data) National: All Houses, All Buyers (Seasonally Adjusted):
|
Period |
Index Jan 1992=100 |
Standardised average price £ |
Monthly change % |
Quarterly change % |
Annual change % |
|
February 2022 |
482.4 |
279,741 |
1.2 |
2.7 |
11.5 |
|
March |
488.0 |
283,001 |
1.2 |
2.5 |
11.1 |
|
April |
493.6 |
286,242 |
1.2 |
2.9 |
10.8 |
|
May |
499.5 |
289,666 |
1.2 |
3.2 |
10.7 |
|
June |
506.3 |
293,586 |
1.4 |
3.6 |
12.5 |
|
July |
505.5 |
293,173 |
-0.1 |
3.2 |
11.8 |
|
August |
507.0 |
293,992 |
0.3 |
2.5 |
11.4 |
|
September |
506.4 |
293,664 |
-0.1 |
1.3 |
9.8 |
|
October |
504.2 |
292,406 |
-0.4 |
0.4 |
8.2 |
|
November |
492.2 |
285,425 |
-2.4 |
-1.1 |
4.6 |
|
December |
485.8 |
281,713 |
-1.3 |
-2.4 |
2.1 |
|
January 2023 |
486.9 |
282,360 |
0.0 |
-3.5 |
2.1 |
|
February |
492.3 |
285,476 |
1.1 |
-2.5 |
2.1 |
Next publication:
The Halifax House Price Index for March will be published at 7:00 a.m. on Thursday 6 April 2023.
Kindly shared by Halifax
Main article photo courtesy of Pixabay


