


UK house prices stable in January – Halifax House Price Index
UK house prices shown to be stable in January, according to the latest publication of the Halifax House Price Index.
Key points from publication:
-
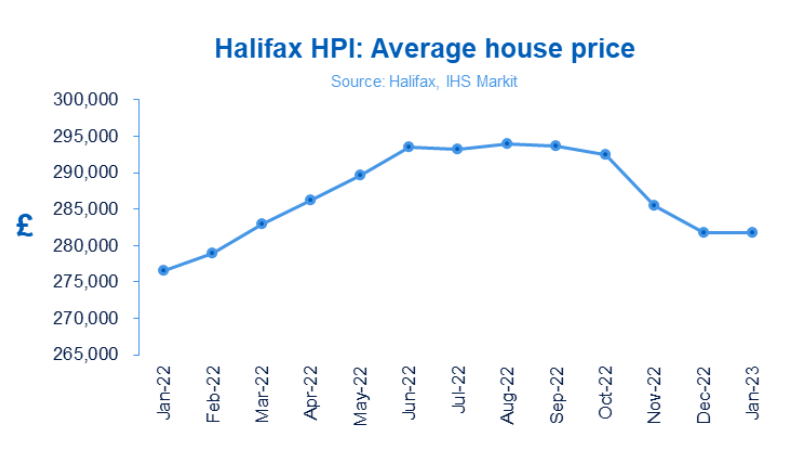
- Typical UK property now costs £281,684 (compared to £281,713 last month)
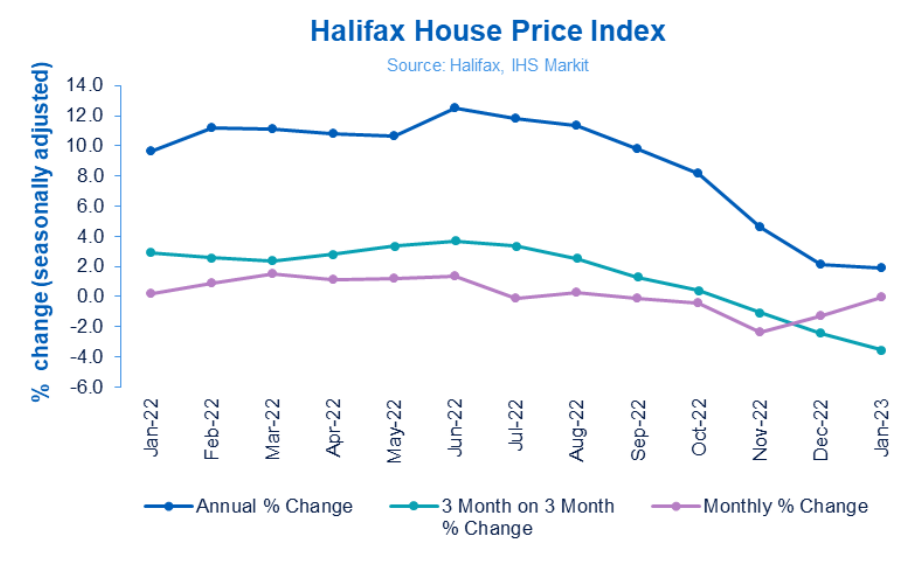
- Follows falls in December (-1.3%) and November (-2.4%)
- Annual rate of house price growth slowed to +1.9% (from +2.1% in December)
- Rate of annual growth slowed in all nations and regions during January
Key metrics:
|
Average house price |
Monthly change |
Quarterly change |
Annual change |
|
£281,684 |
0.0% |
-3.6% |
+1.9% |
Kim Kinnaird, Director, Halifax Mortgages, said:
“The start of 2023 has brought some stability to UK house prices, with the average house price remaining largely unchanged in January at £281,684, a very small decrease on December.
“This followed a series of significant monthly falls at the end of last year (-1.3% in December and -2.4% in November).
“The pace of annual growth has continued to slow, to +1.9% (from +2.1% in December), which is the lowest level recorded over the last three years.
“The average house price is now around £12,500 (-4.2%) below its peak in August last year, though it still remains some £5,000 higher than in January 2022 (£276,483).
“We expected that the squeeze on household incomes from the rising cost of living and higher interest rates would lead to a slower housing market, particularly compared to the rapid growth of recent years.
“As we move through 2023, that trend is likely to continue as higher borrowing costs lead to reduced demand.
“For those looking to get on or up the housing ladder, confidence may improve beyond the near-term.
“Lower house prices and the potential for interest rates to peak below the level being anticipated last year should lead to an improvement in home buying affordability over time.”
Nations and regions house prices
The slowdown in annual house price inflation is reflected in most nations and regions across the UK.
Wales, which recorded some of the strongest annual house price inflation over the last few years, saw its rate of growth fall to +2.0% (from +6.0% in December) with an average house price of £210,275 (down from a peak of £224,210 in August).
The South West of England has also seen annual house price growth slow considerably, now at +2.7% (vs +6.0% in December) with an average house price of £298,853 (dipping below £300,000 for the first time since March last year).
In Northern Ireland and Scotland the pace of annual growth eased more slowly. Those buying a home in Northern Ireland will now pay an average of £183,935 (growth rate of +6.9% vs +7.1% in December), while in Scotland average properties now cost £197,784 (growth rate of +2.4% vs +3.3% in December).
London, which for some time has lagged many other areas of the UK in terms of house price growth, saw the cost of buying an average home fall from £541,472 to £530,396 in January, with annual house price inflation flat (0.0%) compared to +2.9% in December. The price of a typical London home is still around a quarter of a million pounds above the UK national average.
Housing activity:
-
- HMRC monthly property transaction data shows UK home sales decreased in December 2022. UK seasonally adjusted (SA) residential transactions in December 2022 were 101,920 – down by 2.6% from November’s figure of 104,610 (down 2.6% on a non-SA basis). Quarterly SA transactions (October-December 2022) were approximately 0.1% higher than the preceding three months (July 2022 – September 2022). Year-on-year SA transactions were 1.4% higher than December 2021 (1.1% lower on a non-SA basis). (Source: HMRC)
- Latest Bank of England figures show the number of mortgages approved to finance house purchases decreased in December 2022, by 23% to 35,612. Year-on-year the December figure was 51% below December 2021. (Source: Bank of England, seasonally-adjusted figures)
- The December 2022 RICS Residential Market Survey results show further weakening in the sales market activity. The reading for new buyer enquiries came in at a net balance of -39%, marginally down from -38% previously. Agreed sales had a net balance of -41% (-36% previously) and new instructions returned a net balance of -23% (previously -10%) – the weakest since September 2021. (Source: Royal Institution of Chartered Surveyors’ (RICS) monthly report)
UK house prices Historical data National: All Houses, All Buyers (Seasonally Adjusted):
|
Period |
Index Jan 1992=100 |
Standardised average price £ |
Monthly change % |
Quarterly change % |
Annual change % |
|
January 2022 |
476.8 |
276,483 |
0.2 |
2.9 |
9.6 |
|
February |
480.9 |
278,894 |
0.9 |
2.6 |
11.2 |
|
March |
488.0 |
283,001 |
1.5 |
2.4 |
11.1 |
|
April |
493.6 |
286,242 |
1.2 |
2.8 |
10.8 |
|
May |
499.5 |
289,666 |
1.2 |
3.3 |
10.7 |
|
June |
506.3 |
293,586 |
1.4 |
3.7 |
12.5 |
|
July |
505.5 |
293,173 |
-0.1 |
3.3 |
11.8 |
|
August |
507.0 |
293,992 |
0.3 |
2.5 |
11.4 |
|
September |
506.4 |
293,664 |
-0.1 |
1.3 |
9.8 |
|
October |
504.2 |
292,406 |
-0.4 |
0.4 |
8.2 |
|
November |
492.2 |
285,425 |
-2.4 |
-1.1 |
4.6 |
|
December |
485.8 |
281,713 |
-1.3 |
-2.4 |
2.1 |
|
January 2023 |
485.7 |
281,684 |
0.0 |
-3.6 |
1.9 |
Kindly shared by Halifax
Main article photo courtesy of Pixabay


