Latest ONS House Price Index for October 2022 published
The latest ONS House Price Index for October 2022 has been published, covering the figures for house sales up to the end of October 2022.
1. Main points
-
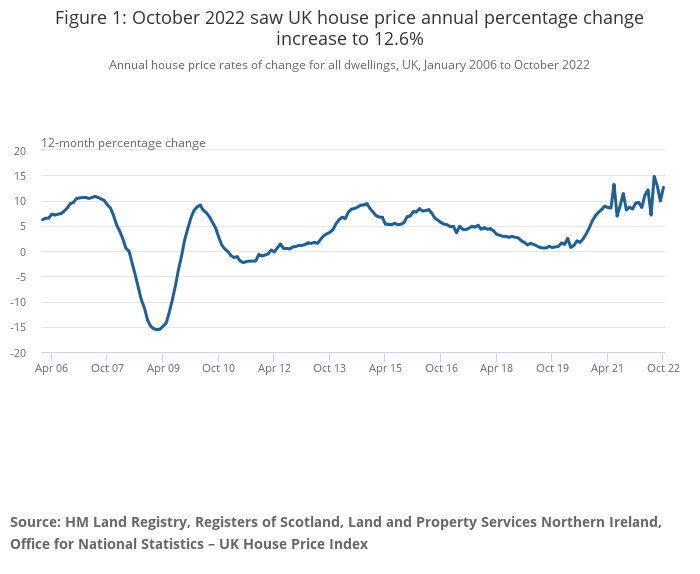
- Average UK house prices increased by 12.6% over the year to October 2022, up from 9.9% in September 2022.
- The increase in the annual percentage change was partly caused by a sharp fall in UK average house prices in October 2021, following changes to Stamp Duty Land Tax.
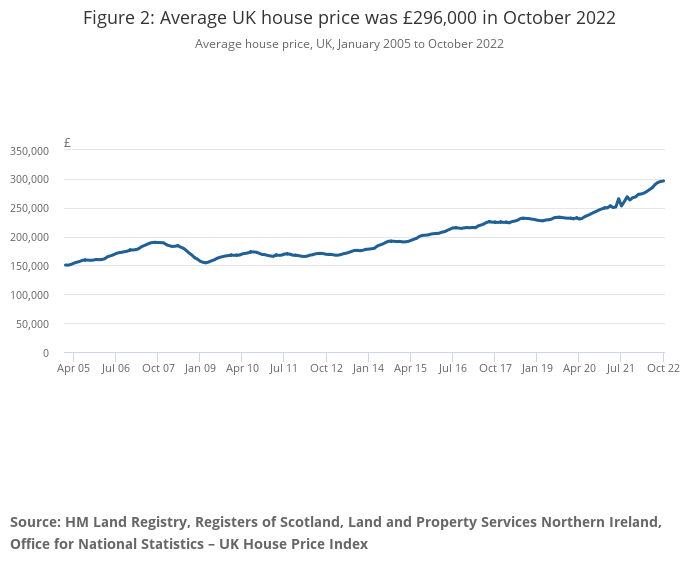
- The average UK house price was £296,000 in October 2022, which is £33,000 higher than this time last year and little changed from last month.
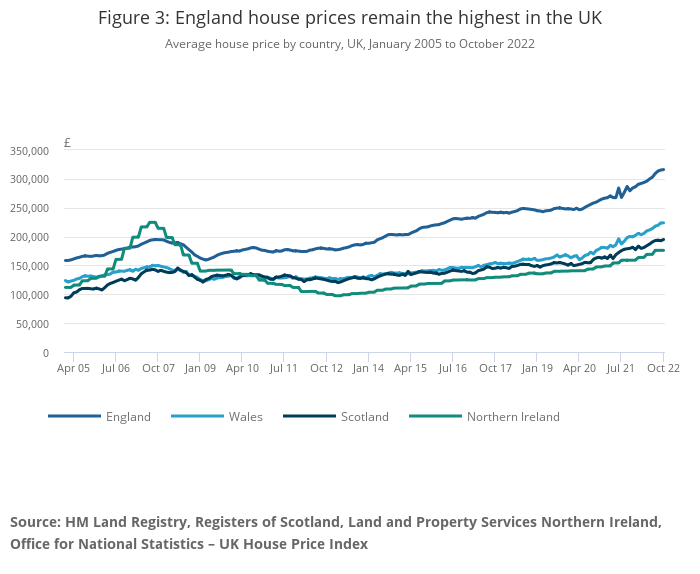
- Average house prices increased over the year to £316,000 (13.2%) in England, to £224,000 in Wales (11.8%), to £195,000 in Scotland (8.5%) and to £176,000 in Northern Ireland (10.7%).
2. UK house prices
The latest house price data published on GOV.UK by HM Land Registry (HMLR) for October 2022 show that average house prices in the UK increased by 12.6% in the year to October 2022. This was up from 9.9% in the year to September 2022.
The coronavirus (COVID-19) pandemic affected the supply of housing transactions for a period of time. Further information can be found in Measuring the data.
Notes:
- Not seasonally adjusted.
- HMLR’s UK House Price Index (HPI) release on GOV.UK is available to download.
Steadily increasing prices throughout 2022 resulted in the average UK house price reaching a record high. The average UK house price was £296,000 in October 2022, which is £33,000 higher than this time last year.
The average UK house price annual percentage change was 12.6% in the year to October 2022, up from 9.9% in the year to September 2022. The increase in annual average house price percentage change was mainly because average UK house prices decreased by £6,000 between September and October 2021, following changes to Stamp Duty Land Tax. This is known as a base effect, as explained in our May 2021 article, Beware base effects.
It is likely that average house prices were slightly inflated in September 2021, as buyers in England and Northern Ireland rushed to complete property purchases before Stamp Duty Land Tax changes at the end of September 2021. Further information on the effect that changes to land taxes had on UK house prices in 2021 can be found in our UK House Price Index: August 2022 bulletin.
The provisional seasonally adjusted estimate of UK residential transactions in October 2022 was 108,480, as shown in HM Revenue and Customs’ (HMRC’s) Monthly property transactions statistics. This is 38% higher than October 2021 and 2.3% higher than September 2022.
Notes:
- Not seasonally adjusted.
- HMLR’s UK House Price Index (HPI) release on GOV.UK is available to download.
The average UK house price was £296,000 in October 2022; this is £33,000 higher than in October 2021.
On a non-seasonally adjusted basis, the average UK house price increased by 0.3% between September and October 2022. The average UK house price decreased by 2.1% between September and October 2021.
On a seasonally adjusted basis, the average UK house price increased by 0.7% between September and October 2022, following an increase of 0.5% in the previous month. The average UK house price decreased by 1.7% between September and October 2021.
3. House prices by country
Notes:
- Not seasonally adjusted.
- The HMLR’s UK House Price Index (HPI) release on GOV.UK is available to download.
- Northern Ireland (NI) data are only available on a quarterly basis; Northern Ireland data will be copied forward until next quarter’s data is available, which will be in the December 2022 bulletin released 15 February 2022.
- Further information on Northern Ireland HPI publications and future release schedules can be viewed.
The average house price in Scotland increased by 8.5% over the year to October 2022, up from an increase of 7.8% in the year to September 2022. The average house price in Scotland was at a record level of £195,000 in October 2022.
The average house price in Wales increased by 11.8% over the year to October 2022, down from an increase of 12.9% in the year to September 2022. The average house price in Wales was at a record level of £224,000 in October 2022.
The average house price in England increased by 13.2% over the year to October 2022, up from an increase of 9.9% in the year to September 2022. The average house price in England was at its record level of £316,000 in October 2022.
The average house price in Northern Ireland increased by 10.7% over the year to Quarter 3 (July to Sept) 2022. Northern Ireland remains the cheapest country in the UK in which to purchase a property, with the average house price at £176,000.
4. House prices by region in England
Notes:
- Not seasonally adjusted.
- HMLR’s UK House Price Index (HPI) release on GOV.UK is available to download.
The North East continued to have the lowest average house price of all English regions, at £168,000 in October 2022, which is a record high for the region.
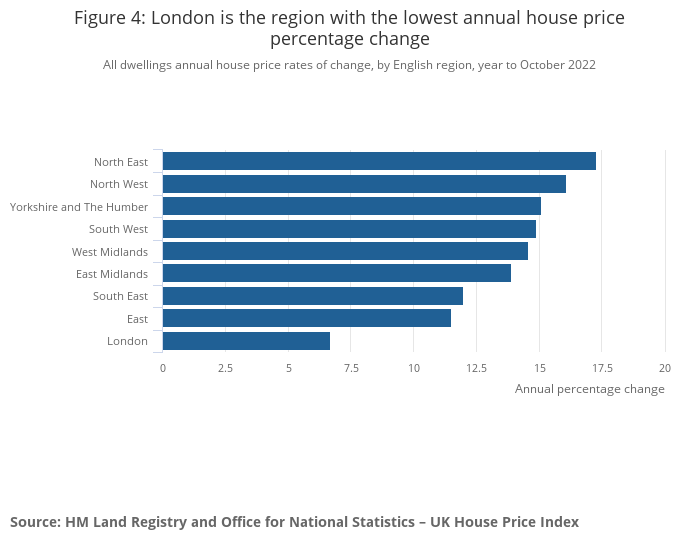
The North East has changed from being the region with the lowest annual house price inflation in September 2022, to the region with the highest house price inflation in October 2022. Average prices in the North East increased by 17.3% in the year to October 2022, up from an annual percentage change of 6.7% in September 2022.
Average house prices in the North East increased by 1.9% between September and October 2022; the largest rise in average house prices of all regions. In contrast, average house prices in the North East decreased sharply by 7.3% in the same period last year. This fall in average house prices followed changes to Stamp Duty Land Tax at the end of September 2021. This base effect has contributed to the large annual percentage change in the North East in October 2022.
London’s average house prices remain the most expensive of any region in the UK, with an average price of £542,000 in October 2022.
London was the region with the lowest annual house price inflation, with average prices increasing by 6.7% in the year to October 2022. This was down from an annual percentage change of 7.4% in September 2022. London’s annual percentage change was slowed by average London house prices falling by 0.9% between September and October 2022. London was the only region in the UK where average house prices decreased this month.
Notes:
- Data at the local authority level and other breakdowns can be found in the HMLR’s UK House Price Index (HPI) release on GOV.UK‘.
- Because of the impact of the coronavirus (COVID-19) pandemic on the supply of housing transactions, we might continue to see larger revisions to the published UK House Price Index (HPI) estimates than usual, particularly at the lower geographical levels where transaction volumes are smaller.
5. House Price Index data
-
- UK House Price Index
Dataset | Released 14 December 2022
Monthly house price movements, including average price by property type, sales and cash mortgage sales, as well as information on first-time buyers, new builds and former owner occupiers. Data are collected by HM Land Registry and published on GOV.UK. - House price data: quarterly tables
Dataset | Released 16 November 2022
Quarterly house price data based on a sub-sample of the Regulated Mortgage Survey. - House price data: annual tables 20 to 39
Dataset | Released 20 July 2022
Annual house price data based on a sub-sample of the Regulated Mortgage Survey.
- UK House Price Index
Kindly shared by Office for National Statistics (ONS)
Main photo courtesy of Pixabay


