Yomdel Property Sentiment Tracker – New landlord enquiries jump, as sellers rise to close gap on huge buyer demand
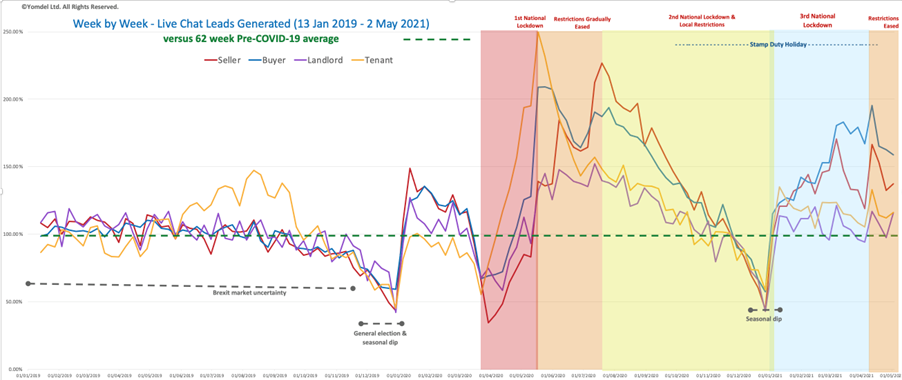
2 MAY 2021. New landlord enquiries were the winners over the past week, rising almost 19%, while vendors seeking estate agents also grew almost 4% and buyers slipped a little, movements that help address current market imbalances, the latest data from the Yomdel Property Sentiment Tracker (YPST) showed.
Highlights (versus previous week):
TRENDS REMAIN HIGH
- New Vendor enquiries: UP 4% (last week DOWN 13%)(38% ABOVE AVERAGE, 62% ABOVE 2020)
- New buyer enquiries: DOWN 2% (last week DOWN 1%)(59% ABOVE AVERAGE, 26% ABOVE 2020)
- New landlord enquiries: UP 19% (last week DOWN 10%)(16% ABOVE AVERAGE, 3% ABOVE 2020)
- New tenant enquiries: UP 4% (last week DOWN 2%)(16% ABOVE AVERAGE, 40% BELOW 2020)
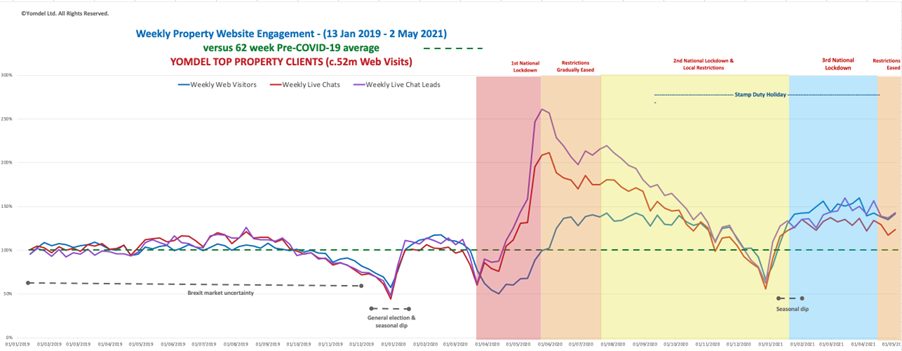
Estate agent website traffic 112% higher year/year, live chat adoption 5% lower year on year, leads captured via live chat 1% lower year on year, but all significantly up on pre-pandemic 2019.
In the week to midnight Sunday, activity across own-branded estate agent websites remained exceptionally strong, and new enquiry levels across the board were well above levels normally seen at this time of year, with web traffic 112% above the same week last year, and significantly up on 2019, the last “normal” pre-Covid year.
Yomdel provides 24/7 managed live chat services to 3,800 estate agent offices in the UK, handling more than a 2m chats per year. It has analysed the data and leads captured in live chat going back to January 2019, up until week ending 2 May 2021. The website visitor data is a sample across major estate agency groups in the UK and covers in excess of 52 million unique website visits back to January 2019.
YOMDEL PROPERTY SENTIMENT TRACKER (w/e 2 MAY 2021)
View and download this graph at: https://www.yomdel.com/property-sentiment-tracker
Andy Soloman, Yomdel Founder and CEO, said:
“While the growth in vendors and landlords will be welcomed by agents staring at rapidly diminishing stock levels, the market remains incredibly tough and the need for new sales stock in particular is becoming acute if future pipelines are to be protected.
“Everything is happening at elevated levels when compared to normal and this creates real strain on every part of the transaction. Add in huge delays in mortgages and conveyancing and agents need to pull out all the stops to ensure transactions keep moving.”
The YPST methodology establishes a base line average shown as 100% or 100, calculated according to average engagement values over the 62 weeks prior to the first national lockdown on 23 March 2020, and plots movements from there according to the volumes of people engaging in live chat, their stated needs, questions asked, and new business leads generated. Data is measured over full 24-hour periods.
New vendors rose 3.70%, or 4.91 points, to end the week on 137.51, some 38% above the average, 62% higher than the same week last year at the beginning of the initial lockdown, and 22% above the equivalent week 2019.
Buyers slipped 2.39%, or 3.88 points, to close at 158.79, 59% above the pre-covid-19 average, 26% above the same week 2020 and 45% higher than the equivalent week 2019 before coronavirus hit.
Landlords jumped 18.89%, or 18.41 points, to 115.87, some 16% above the average, 3% higher than the same week last year, and 1% higher than the same week 2019.
Tenants grew 3.83%, or 4.29 points, to close at 116.29 some 16% above the pre-covid-19 average, 40% lower than the same week last year, and 5% higher than the equivalent week 2019.
The following graph looks at the relationship between website visitor volumes, live chat volumes and the volume of leads generated. The data samples more than 52 million visitors to estate agent websites from Jan 2019 – 2 May 2021 and shows how web traffic (blue line) is 112% higher than the same week last year. The volume of people using live chat (red line) and the numbers of new business leads captured (purple line) are 5% and 1%, respectively, below the same week 2020 but 11% and 31%, respectively, above the same week 2019.
YOMDEL ESTATE AGENT WEBSITE TRACKER (w/e 2 MAY 2021)
View and download this graph at: https://info.yomdel.com/property-website-tracker
Kindly shared by Yomdel
Main article photo courtesy of Pixabay


